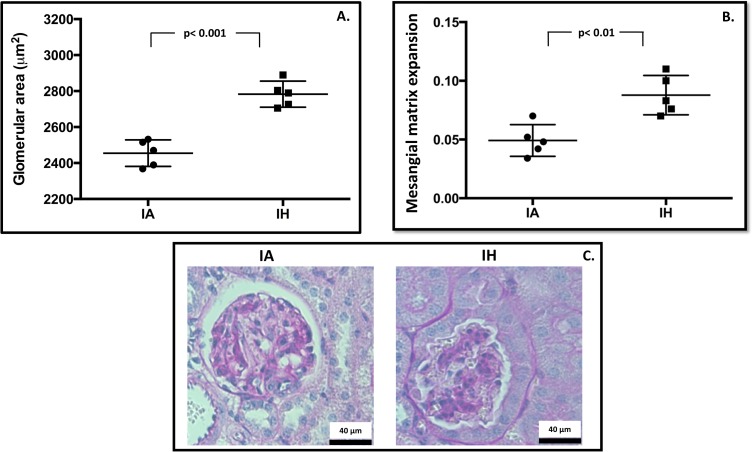
Fig 3. Histological evaluation.
(3A) The glomerular tuft area was averaged from all available glomeruli per kidney section to give n = 1, using one kidney section per animal. (3B) Mesangial matrix fraction was calculated as the ratio of PAS positive area to total glomerular tuft area and averaged from 50 randomly selected glomeruli per kidney section to give n = 1. (3C) Examples of PAS-stained kidney sections; images taken at 400x magnification. Mesangium indicated as PAS-stained (purple) nuclei-free area within the glomerular tuft area. IA: Intermittent air, IH: Intermittent hypoxia; unpaired t-test, (n = 5).

