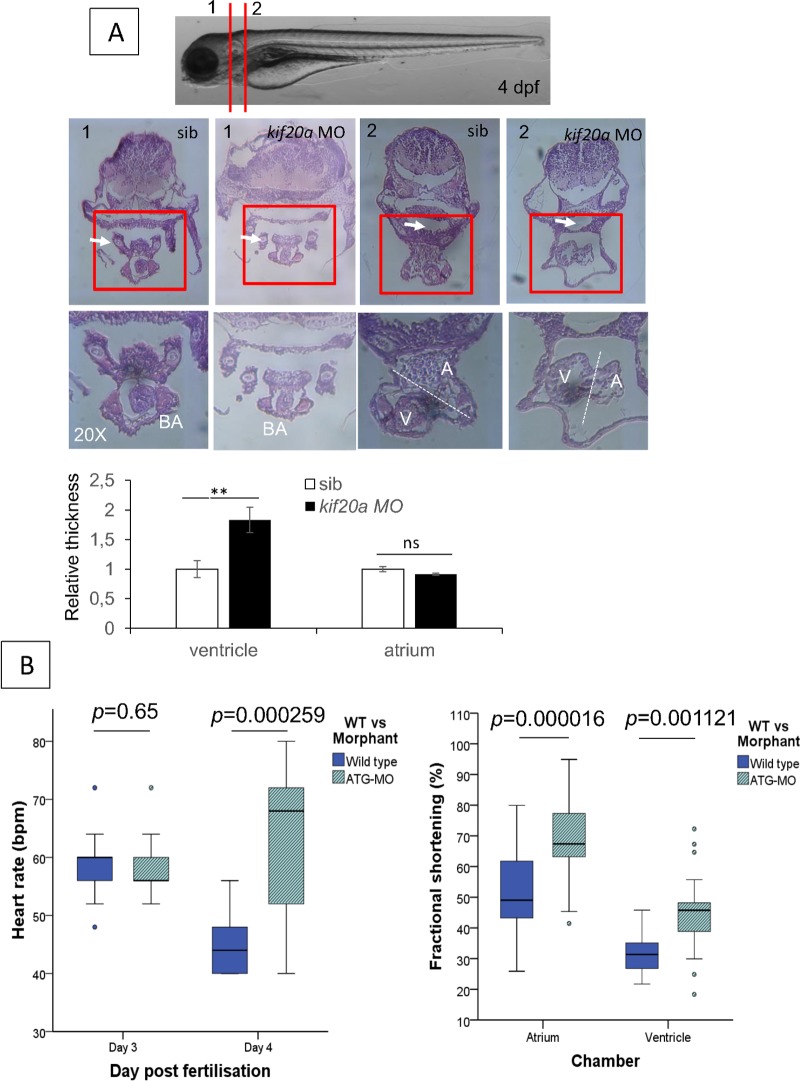
Fig 6. Histology and cardiac function evaluation of zebrafish kif20a morphants.
H&E staining of zebrafish embryos injected with control MO and kif20a MO at 4 dpf. Upper panel: Bright-field images of control and kif20a morphants at 4 dpf showing the section locations 1 and 2. Middle panel: Representative H&E staining images of control and kif20a morphants at position 1 and 2 in 10x and 20x magnification. White arrows in position 1 indicate the aortic arch, and white arrows in position 2 indicate gut. Lower panel: Quantification of ventricle and atrium thickness using H&E staining data above. Data are represented as mean ± SD. Stars represent the results of one-way ANOVA-Dunnett’s post hoc test (*p<0.05, **p < 0.01, ns, not significant). (B) Cardiac function analysis. Left panel: Heart rate in beats per minute is compared in control and kif20a morphants at 3 dpf and 4 dpf. A significant increase in heart rate is observed in the morphants at 4 dpf, most likely due to progressive cardiac failure. Right panel: Fractional shortening measured at 4dpf is compared in control and kif20a morphants respectively in the atrium and ventricle. Although a significant increased fractional shortening is present in the morphants, more outliers are seen, suggesting systolic failure.

