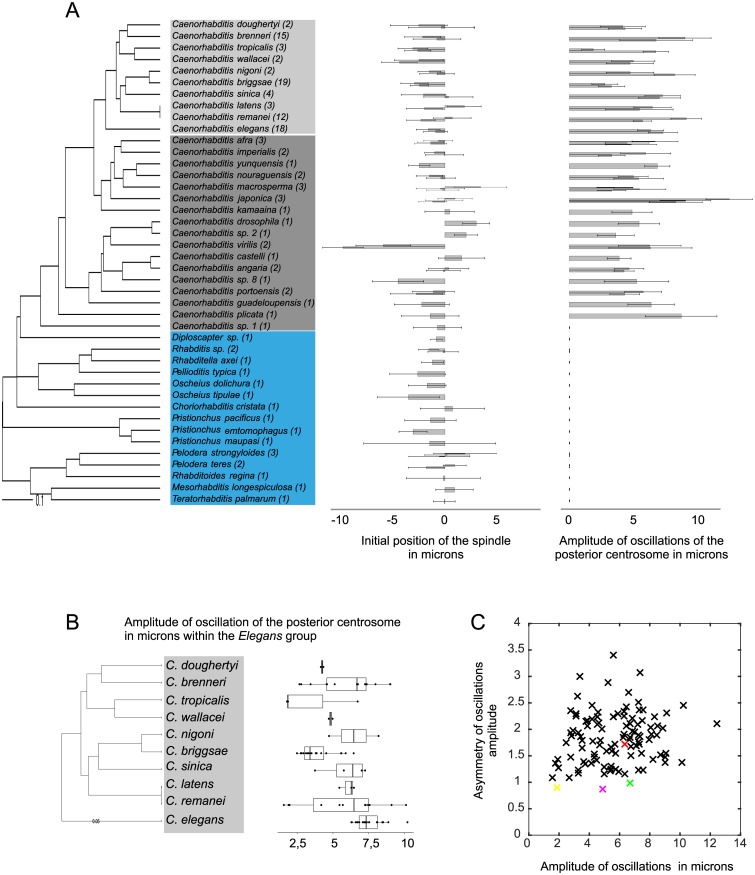
Fig 2. Intra- and inter-species variations in cellular traits.
(A) (Left) Phylogeny of the species used in this study. Numbers in parentheses are strains per species. Within the Caenorhabditis genus, species from the Elegans group are shown in light gray, from the non-Elegans group in dark gray. Other genera are shown in blue. (Right) Initial position of the spindle relative to the cell center and amplitude of oscillations of the posterior centrosome (both in μm). Bars represent the mean ± SD of all strains per species except for the Elegans group, for which two strains per species were chosen at random. Underlying numerical values are shown in S5 Table. (B) Box and whisker plot of the amplitude of oscillations (μm) of the posterior centrosome for all species of the Elegans group. Each dot corresponds to one strain, and the box and whiskers represent the median, quartiles, and 1.5 interquartile range. Underlying numerical values are provided in S4 Table. (C) Asymmetry of the maximum oscillation amplitudes (ratio of the posterior centrosome maximum amplitude over the anterior centrosome maximum amplitude) relative to that of the posterior centrosome (μm). Each cross represents a strain, with C. elegans N2 in red, C. tropicalis JU1428 in yellow, C. kamaaina QG122 in magenta, and C. brenneri VX0044 in green. The latter three are examples of species showing equal oscillation amplitudes for the anterior and posterior centrosomes. Underlying numerical values are provided in S4 Table.

