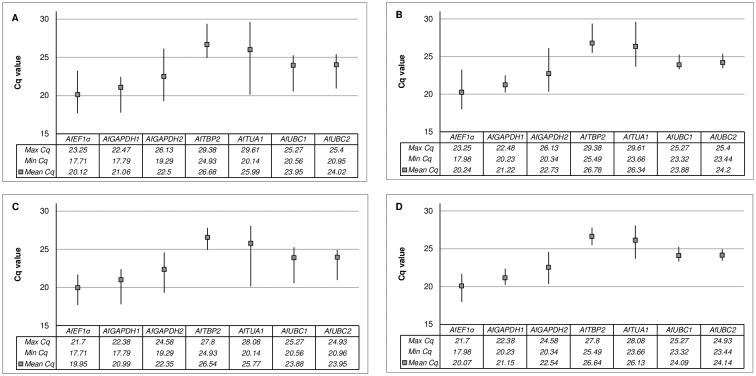
Fig 1. Distribution of candidate reference gene Cq values.
The data represent raw qRT-PCR values obtained for different sample sets: Total (A), dry and imbibed caryopses (B), only imbibed caryopses with (C) or devoid of seedling organs (D). Whiskers indicate the Cq range. The mean Cq value is indicated by a filled square.

