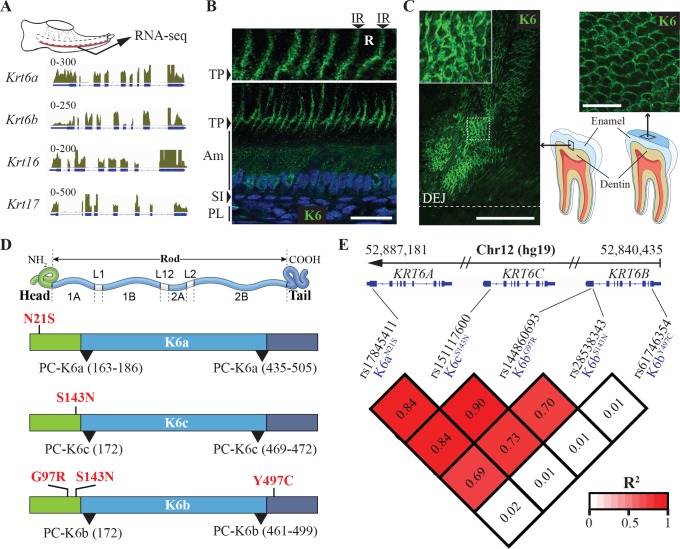
Fig 1. K6 proteins in enamel and genetic association between missense SNPs in KRT6 genes and tooth decay experience.
(A) RNA-seq data from mouse enamel organ showing expression of Krt6a, Krt6b, Krt16 and Krt17 in the tissue. The schematics at the top shows a mouse mandible at postnatal day 10 from which the enamel organ (red) was micro-dissected for RNA extraction. Tracks represent the alignment of the RNA-seq reads to the mouse genome for the Krt6a, Krt6b, Krt16 and Krt17 loci. (B) Immunohistochemical analysis of K6 distribution in rat enamel organ at postnatal day 10. Anti-K6 antibody recognizes all members of the K6 family (K6a and K6b in rodents). Nuclei are stained with DAPI (blue). Inset at the top shows enlarged view of Tomes’ processes. PL, papillary layer; SI, stratum intermedium; Am, ameloblasts; TP, Tomes’ processes; R, rod; IR, interrod. Scale bar: 50 μm. (C) Immunohistochemical detection of K6 on polished sections of human third molars. Antibody raised in guinea pig against the N-terminal of K6 (recognizes K6a, K6b and K6c in humans) was used (green). As indicated by the schematics on the bottom right corner, the image in the left panel was acquired from mesial-distal sections of human third molars and shows the area of enamel adjacent to dentin, whereas the image in the right panel was acquired from transverse section of the crown near the cusps. DEJ, dentin-enamel junction. Scale bars: 100 μm for left panel, 20 μm for right panel. (D) Schematics showing the structure of keratin proteins with a central rod domain flanked by a head domain and a tail domain. Shown in red are the position of the five missense SNPs in KRT6A, KRT6B and KRT6C that were found to have significant genetic association with tooth decay risk as measured by three indices of dental caries experience. All SNPs associated with high caries experience in adults resulted in substitutions in the head domain of K6 proteins, while the unique SNP that showed association with tooth decay risk in children only results in a substitution in the tail domain of K6b (Y497C). Areas where mutations leading to PC have so far been identified are highlighted by black arrowheads and are exclusively at the beginning and at the end of the rod domain. (E) Linkage disequilibrium data measured by R2 between the five missense polymorphisms highlighted in D.

