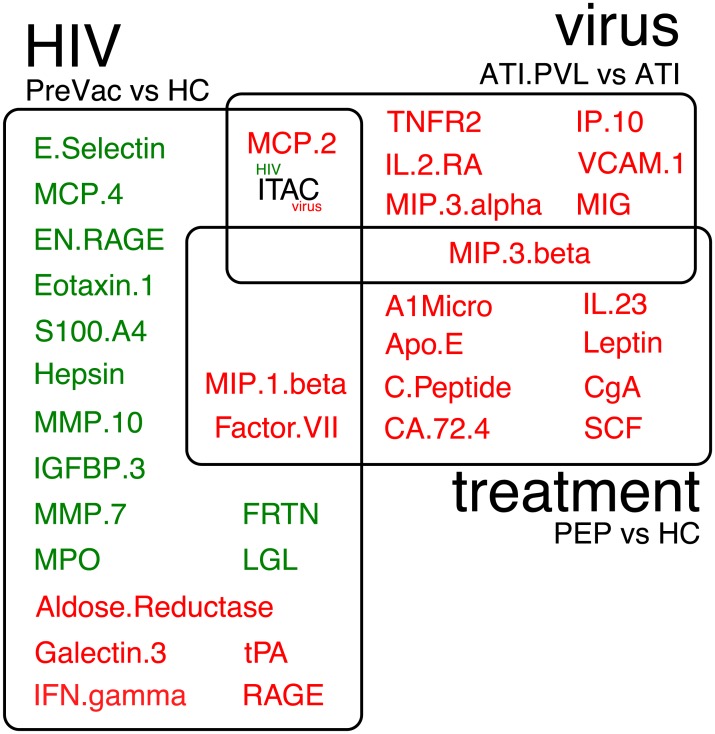
Fig 4. Differential expression analysis of analytes.
The names of analytes that are differentially expressed are depicted in circles for HIV infection stable on treatment vs healthy controls (‘HIV+’), cART treatment being treated HIV negative vs health control (‘treatment’) and virus reactivation as seen after stop cART, i.e., ATI.PVL—ATI (called ‘reactivation’). Up- and down-regulated analytes are depicted in red or green, respectively. ITAC is up-regulated during virus reactivation and down-regulated in during HIV infection.

