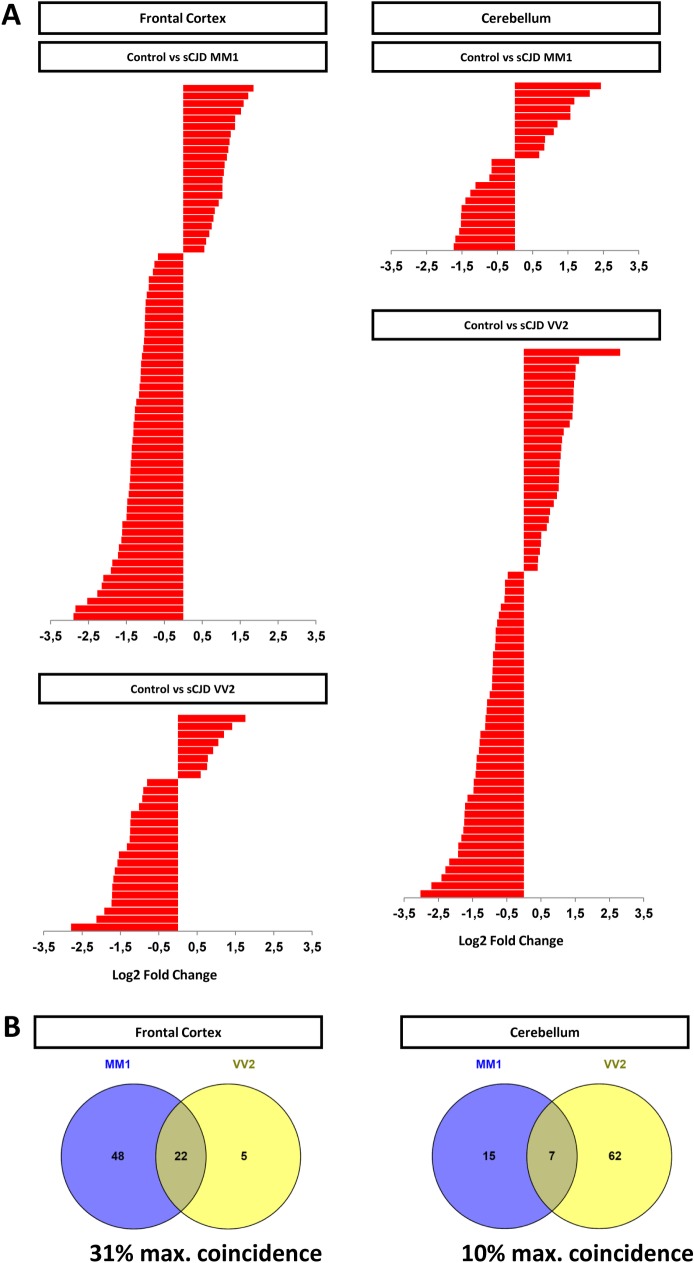
Fig 1. Small RNA-Seq analysis and miRNA expression levels in the FC and CB of sCJD.
(A) Relative quantitation of regulated miRNAs in the FC and CB of sCJD MM1 and VV2 subtypes compared to age and gender matched controls by small RNA-Seq. For FC 13 controls, 11 sCJD MM1 and 13 sCJD VV2 were analyzed. For CB: 12 controls, 12 sCJD MM1 and 9 sCJD VV2 were analyzed. Differential expression in miRNA sequencing data was evaluated with the DESeq2 tool and significantly differently expressed miRNAs were detected according to an adjusted p value of <0.05. Data represent log2 fold change for each comparison. log2 fold change was >0.5 for upregulated miRNAs and <-0.5 for downregulated miRNAs. MA plots are also supplied for data visualization (S1 Fig). (B) Venn diagram of subtype-dependent altered miRNA in the FC and CB of sCJD by small RNA-Seq. Percentage of maximal coincidence (percentage of maximal number of miRNAs that can be coincident between groups) is indicated.

