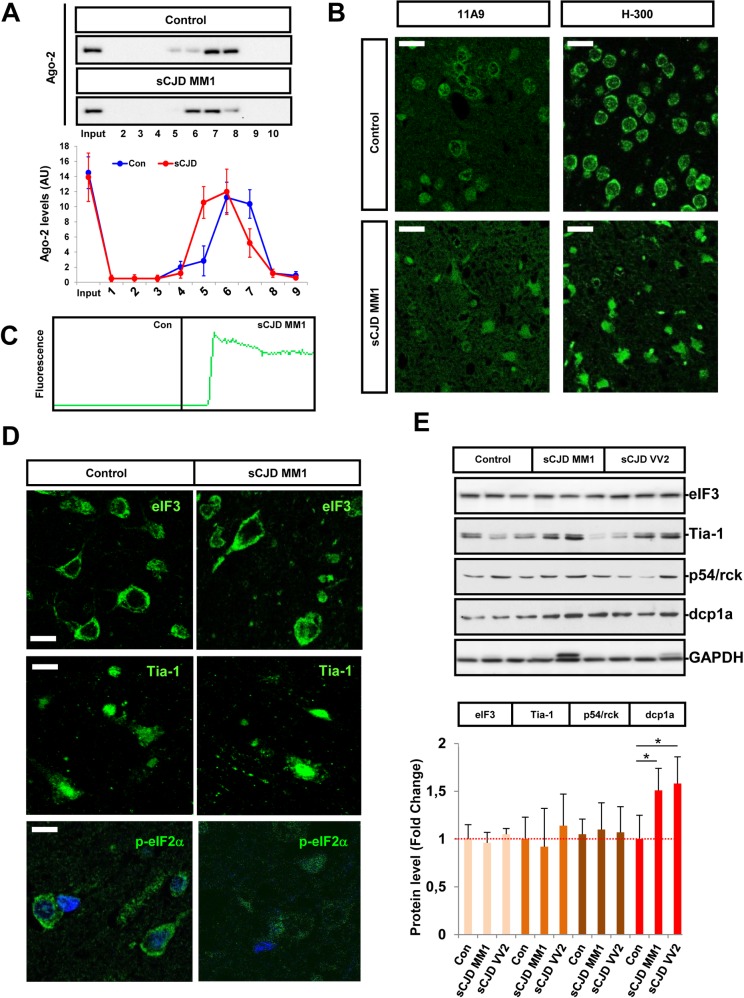
Fig 3. Alterations in the levels and distribution of the miRNA silencing machinery in sCJD.
(A) Western blot analysis for Ago-2 immunodetection (upper panel) and densitometry (lower panel) of the chromatography gel filtration fractions from the FC of control (n = 3) and sCJD MM1 (n = 3) cases. Western blot analysis shows a representative image of a control and a sCJD case, while densitometry shows mean values and SD of all cases studied. (B) Representative fluorescence photomicrographs of Ago immunoreactivity in the FC of control and sCJD MM1 cases. The two antibodies used (11A9 and H-300) showed similar Ago distribution between control and sCJD MM1 cases. Scale bar = 25μm (C) RT-QuIC analysis of Ago-2 immunoprecipitates (11A9) obtained from the FC of brain homogenates of control (n = 3) and sCJD MM1 (n = 3) cases. RT-QuIC assays were run in triplicate for each sample. A representative curve for each condition is shown. (D) Representative fluorescence photomicrographs of eIF3, Tia-1 and p-eIF2α(Ser51) immunoreactivity in the FC of control and sCJD MM1 cases. Scale bar for eIF3 = 10 μm and Tia-1 = 20μm, for p-eIF2α(Ser51) = 10μm (E) Western blot analysis of eIF3, Tia-1, p54/rck and dcp1a in the FC of control, sCJD MM1 and VV2 cases. Three representative cases per diagnostic group and brain region are shown in the western blot. Quantifications derived from densitometry analysis were performed in 15 cases per diagnostic group (n = 15/group). GAPDH was used as a loading control. Densitometries of the western blots are shown. Normalization was performed relative to controls. Error bars indicate SD. In all cases, statistical significance (compared to controls) was set at *p<0.05.

