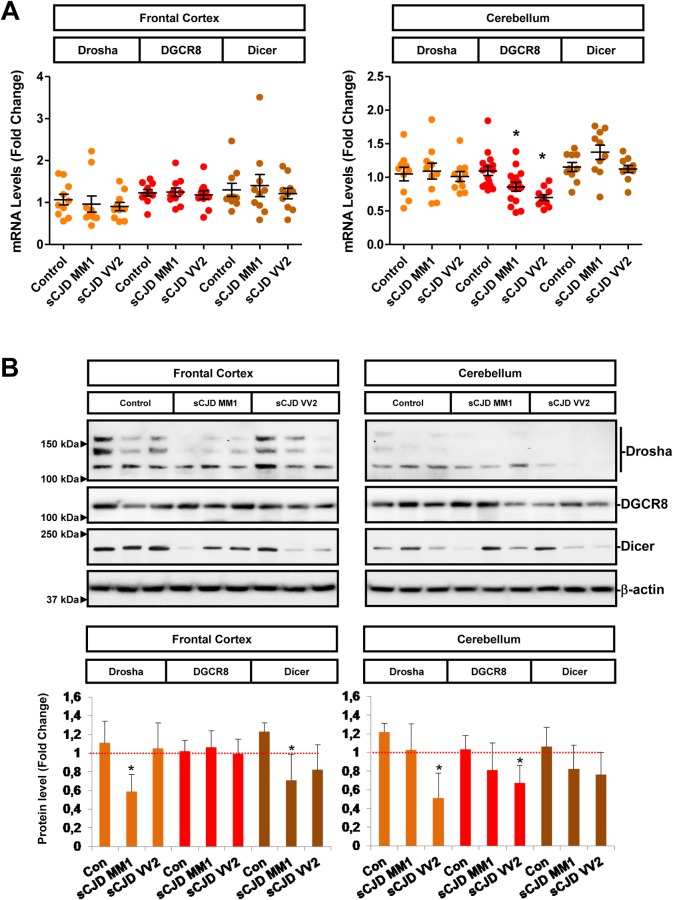
Fig 4. Altered expression levels of miRNA biogenesis components in sCJD.
(A) Gene expression levels of Drosha (n = 10), DGCR8 (n = 10) and Dicer (n = 10) in the FC and CB of controls, sCJD MM1 and VV2 cases by RT-qPCR. Results were normalized to housekeeping genes GAPDH (figure) and GUSB with similar results. Housekeeping levels remained unaltered between groups. (B) Protein levels of Drosha, DGCR8, Dicer in the FC and CB of controls, sCJD MM1 and VV2 cases, by western blot analysis. Three representative cases per diagnostic group and brain region are shown in the western blot. Quantifications derived from densitometry analysis were performed in 15 cases per diagnostic group (n = 15/group). β-actin was used as a loading control. Densitometries of the western blots are shown. Normalization was performed relative to controls. Error bars indicate SD. In all cases, statistical significance (compared to controls) was set at *p<0.05.

