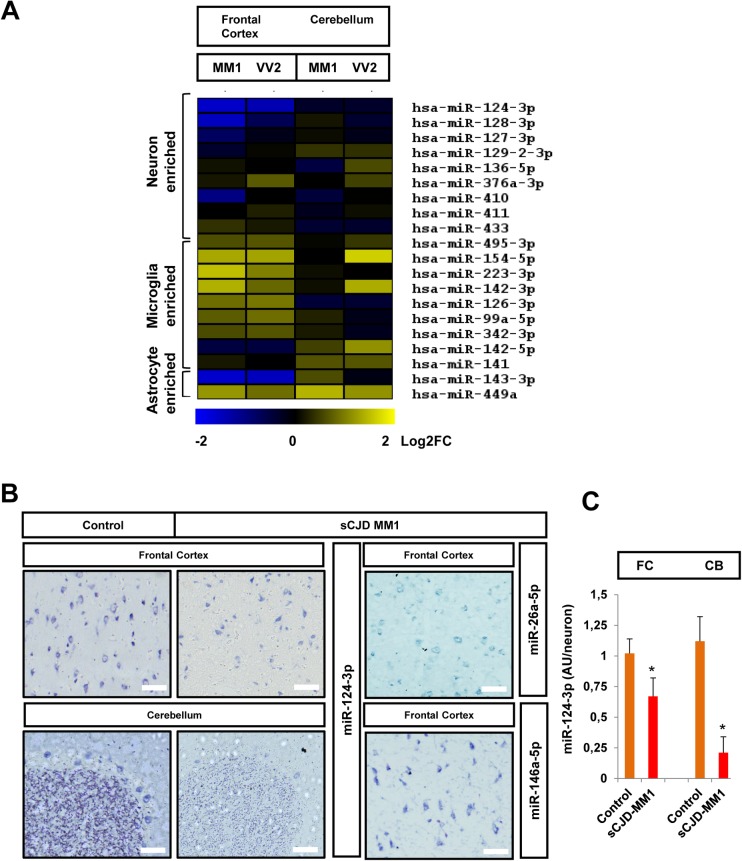
Fig 5. Neural-type miRNA profiling in sCJD.
(A) Heat map analysis of the neuron, microglia and astrocyte enriched miRNAs, whose levels were changed in the FC and CB of sCJD MM1 and VV2 cases by RNA-seq analysis. Neural-type enriched miRNAs were reported in the bibliography based on neural-type enrichment analysis (49). (B) In situ hybridization of miRNA-124-3p in the FC and CB of control and sCJD MM1 brain tissue, and of miRNAs 26a-5p and 146a-5p in the FC of sCJD MM1 brain tissue. (C) Quantification of miRNA-124-3p intensity in the FC and CB of control and sCJD MM1 neurons. >100 neurons in total were quantified for each group. Normalization was performed relative to controls. AU/neuron indicates arbitrary units quantified in the densitometry analysis for each neuron. Error bars indicate SD. Scale bar in FC = 30μm and in CB = 50μm. In all cases, statistical significance (compared to controls) was set at *p<0.05.

