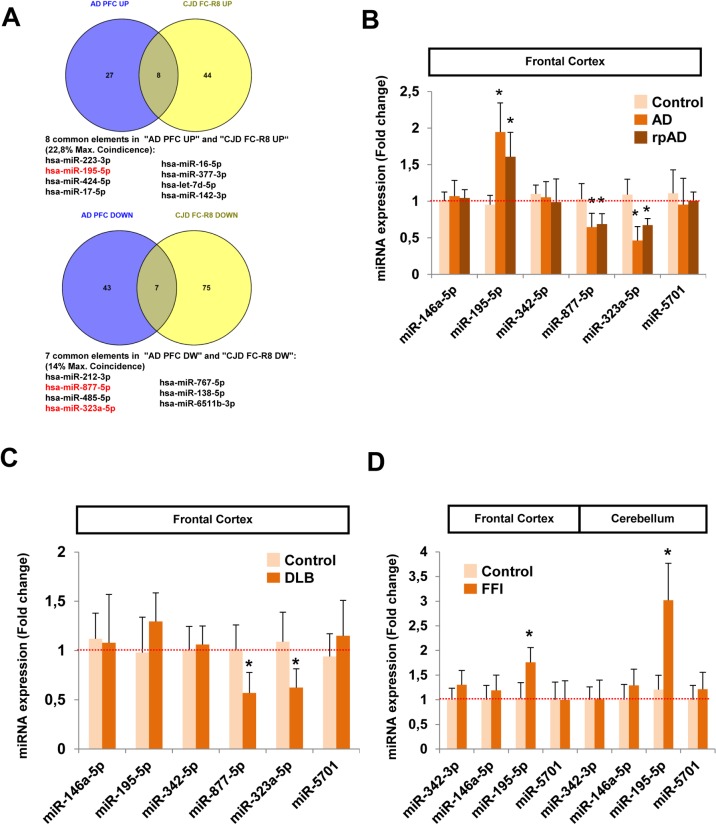
Fig 6. Analysis of commonly altered miRNAs in sCJD, AD, DLB and FFI.
(A) Venn diagrams of the comparison between altered miRNAs in AD and sCJD. Commonly deregulated miRNAs in the PFC of AD cases obtained from small RNA-seq analysis (20) (blue circles) and in the FC of sCJD cases obtained from small RNA-seq analysis in the present work (yellow circles). Common elements and percentage of maximal coincidence between groups are shown. Among these, the deregulated expression levels of miRNA-195-5p, miRNA-877-5p and miRNA-323a-5p (marked in red) were previously validated by qPCR in the FC of sCJD cases (Fig 2). (B) RT-qPCR analysis for miRNA-146a-5p, miRNA-195-5p, miRNA-342-5p, miRNA-877-5p, miRNA-323a-5p and miRNA-5701 in the FC of controls (n = 5), AD (n = 8) and rpAD (n = 6) cases. (C) RT-qPCR analysis for miRNA-146a-5p, miRNA-195-5p, miRNA-342-5p, miRNA-877-5p, miRNA-323a-5p and miRNA-5701 in the FC of controls (n = 5) and DLB (n = 5) cases. (D) RT-qPCR analysis for miRNA-342-5p, miRNA-146a-5p, miRNA-195-5p and miRNA-5701 in the FC and CB of controls (n = 3) and FFI cases (n = 3). Results were normalized to the housekeeping U6 snRNA expression, which remained unaltered between groups. Normalization was performed relative to controls. Error bars indicate SD. In all cases, statistical significance (compared to controls) was set at *p<0.05.

