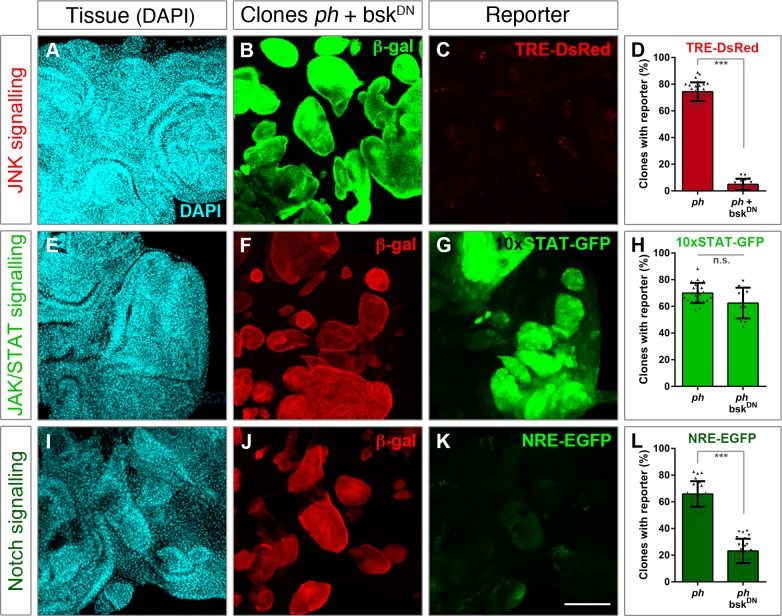
Fig 3. Blocking JNK signalling does not impair JAK/STAT but impacts on Notch.
The effect of blocking JNK signalling was assessed using reporters for the three pathways. (A-D) TRE-DsRed was used for JNK signalling, (E-H) the 10xSTAT-GFP reporter for JAK/STAT, and (I-L) NRE-EGFP as a read-out of the Notch pathway. The left panels show tissue morphology with DAPI staining (A,E,I), followed by panels depicting the distribution of ph clones expressing bskDN. Clones are marked by β-gal expression, either in green (B) or red (F,J) depending on the fluorescence of the corresponding reporter. For each condition, the percentage of ph clones showing reporter activity was measured, as shown in comparison to ph clones alone (right panels). The bar plots represent the average proportion of clones with reporter expression; error bars represent standard deviations; *** p<0.005 (Student t-test). Scale bar represents 100 μm.

