
Figure 4.
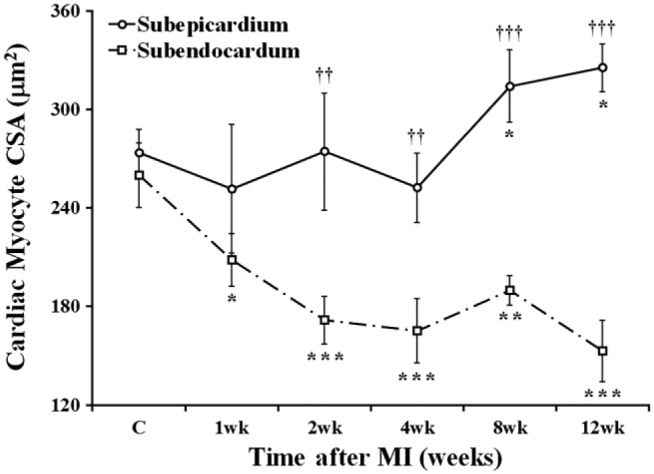
Time course of changes in CSA of the cardiac myocytes surviving in subepicardial and subendocardial regions of the transmural scar during 12 post-MI weeks. Data are Mean ± SD; *p<0.05, **p<0.01, and ***p<0.001 versus cardiac myocytes in corresponding groups of the control rats (C); ††p<0.01 and †††p<0.001 versus cardiac myocytes in subendocardial region of the same rats. Abbreviations: CSA, cross-sectional area; MI, myocardial infarction.