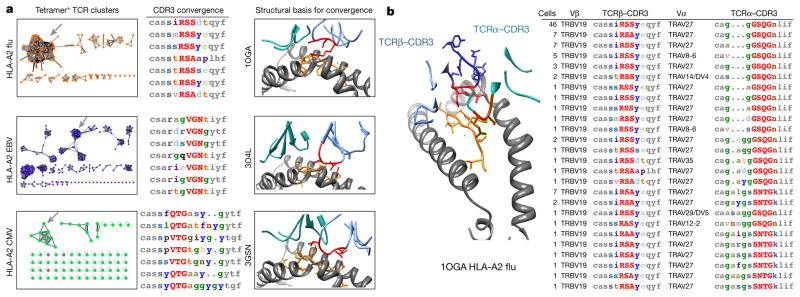
Figure 2. Crystal structure representatives of TCR specificity groups reveal the structural basis for antigen-specific paratope convergence.
a, Network analysis of tetramer+ CDR3 clusters indicates relationships between TCRs (nodes) sharing global CDR3 similarity (black edges) or local CDR3 motifs (grey edges: motifs >10 fold enriched, 0.001> probability of enrichment by chance). Grey arrows indicate representative specificity group, accompanied with representative CDR3 alignment and crystal structure. Significant motif residues are highlighted in red in both CDR3 alignments and structure. In alignments: low contact probability, grey. In structures: MHC, grey; peptide, orange; TCRβ, light blue; TCRα, cyan. b, Single-cell paired α/β sequencing with crystal structure representative reveals coordinated motifs in both TCRβ and TCRα CDR3 that define paratope specificity.

