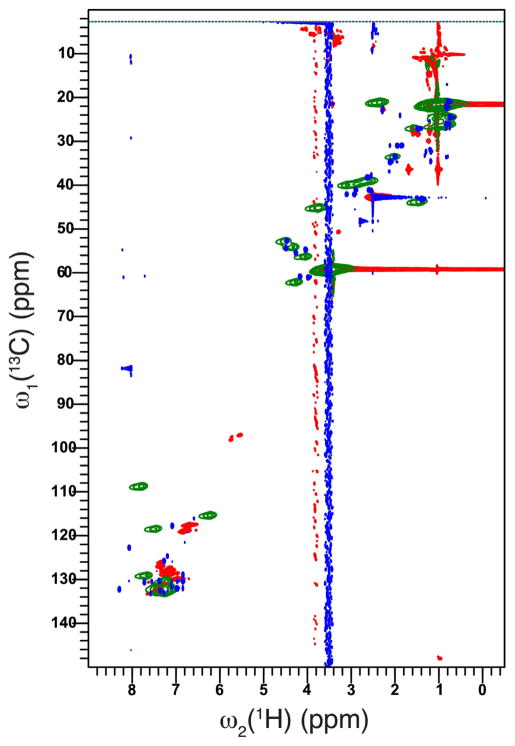
Fig. 4.
Overlay of 2D 1H–13C HSQC spectra of free polyaniline (green) with free pentapeptide (blue) and peptide-bound polyaniline (red). Spectra were recorded on a 700 MHz spectrometer at 298 K. (For interpretation of the references to color in this figure legend, the reader is referred to the web version of the article.)

