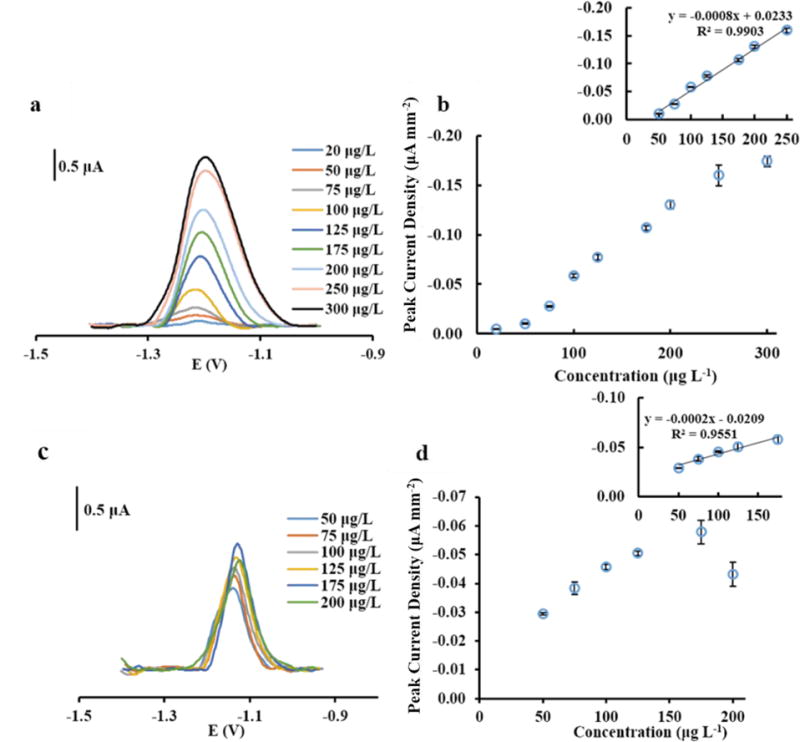
Figure 6.

(a) Square-wave voltammograms of Co(II)DMG complex from 1–100 μg L−1 using 15 s deposition time. (b) Representative calibration graph for Co(II)DMG complex. Linear fit of calibration graph for Co(II)DMG complex (b inset) (n=3). (c) Square-wave voltammograms of Ni(II)DMG complex from 5–100 μg L−1 using 45 s deposition time. (d) Representative calibration graph for Ni(II)DMG complex. Linear fit of calibration graph for Co(II)DMG complex (d inset) (n=3).
