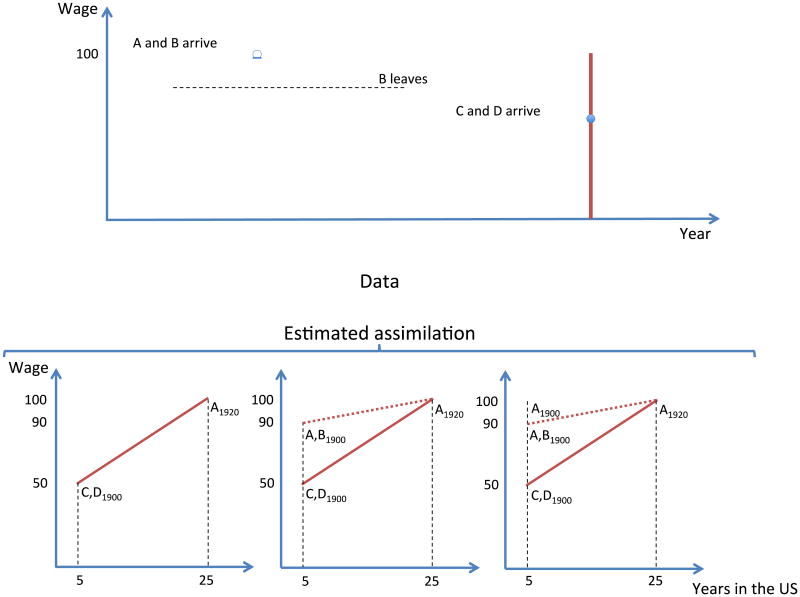
Figure 5. Inferring assimilation from cross sectional and panel data.
Notes: The top graph depicts the earnings of four hypothetical migrants. For illustrative purposes, we assume that natives earn 100 in every year. Migrants A and B arrived in 1895 and earn 100 and 80 respectively. Migrant B returns to his home country in 1909. Migrants C and D arrived in 1915 and earn 60 and 40 respectively.
The bottom row of graphs depicts inferred assimilation profiles from a series of hypothetical datasets containing subsets of these migrants. With a single cross section of data (say, the 1920 census), a researcher would compare the earnings of immigrants C and D (who arrived in 1915) to the earnings of immigrant A (who arrived in 1895) and infer that immigrants fully close the earnings gaps with natives after 25 years in the US. With repeated cross sections, a researcher would follow the cohort that arrived in 1895 (immigrants A and B), say between the 1900 and 1920 Census. As immigrant B leaves the US, the average earnings of the cohort increase despite the fact that, by construction, they are constant over time for each individual immigrant. A panel dataset allows researchers to measure the true pace of earnings growth over time.

