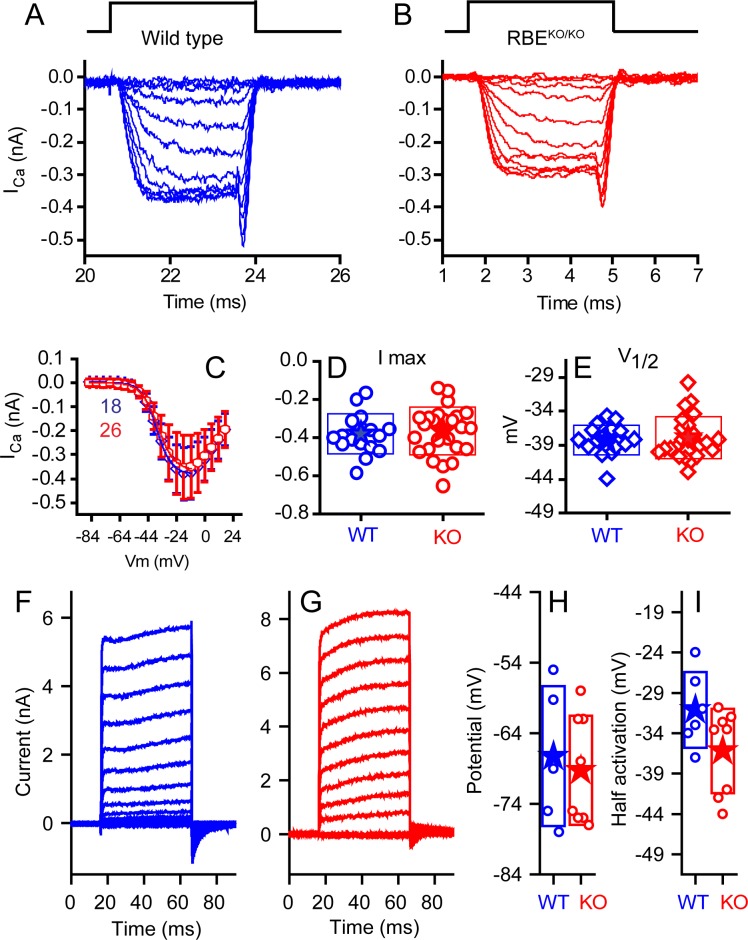
Figure 5. No differences were observed in calcium or potassium currents between KO and WT animals.
Ca2+ currents obtained from mice ranging in age from P10–P12 for WT (A, blue) and P10–P13 KO (B, red), with time course of stimulus shown above, are comparable in all measured properties. Voltage-current plots, presented in (C) as mean ± SD show no difference (n provided in figure). Summaries of peak current (D) and voltage of half activation (V1/2, E) are not statistically different (n = 18 for WT and n = 26 for KO, p=0.13 for peak current and 0.326 for V1/2). Potassium currents, obtained from responses to 50 ms voltage pulses ranging from −124 mV to 16 mV in 10 mV increments, from a holding potential of −84 mV are presented in (F) for WT and (G) for KO mice at P24. A summary of the half activation voltage as estimated from a Boltzmann fit to the tail current voltage-current (H) found no statistical difference (n = 6 and 8 for WT and KO, respectively, with p=0.084). Current-clamp measurements found no difference in resting potential (I) (n = 5 and 8 for WT and KO, respectively, p=0.69).

