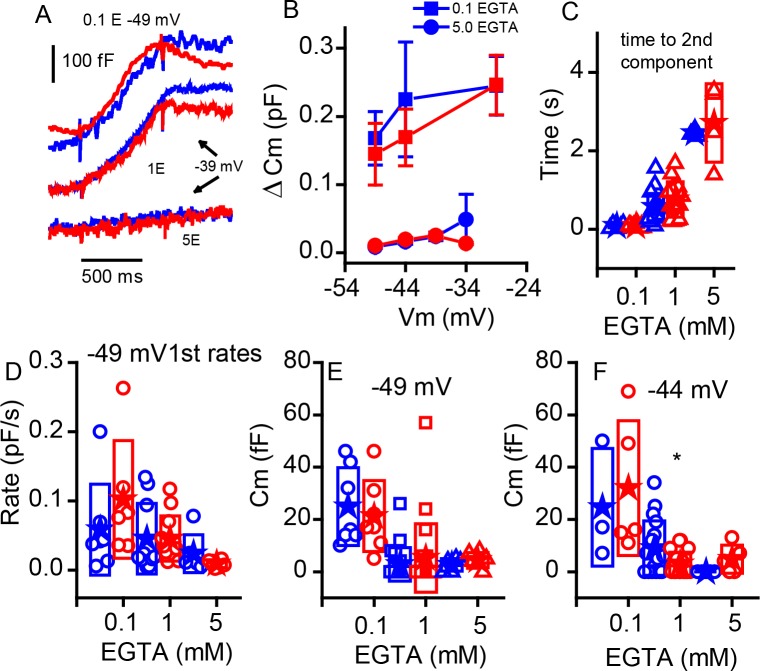
Figure 7. Changing internal Ca2+buffering does not distinguish phenotypes.
(A) Example records of Cm changes in response to 1 s depolarizations from −49 mV in 0.1 EGTA and −39 mV in 1 and 5 mM EGTA for WT (blue) and KO (red). (B) Plot of the change in Cm in response to 1 s voltage steps of −49, –44 and −29 mV for 0.1 mM EGTA and −49, –44, −39 and −34 mV for 5 mM EGTA, n provided in figure. (C) The time to the second component increases significantly with elevated Ca2+ buffer (p-value indicated in figure) but is similar between genotypes: for 0.1 mM EGTA, n = 7 for WT and n = 6 for KO, p=0.93, steps to −29 mV for WT and KO; for 1 mM EGTA, n = 15 for WT and n = 13 for KO, with p=−0.13, steps to −36 ± 8 mV WT and −37 ± 9 mV KO; and for 5 mM EGTA, n = 3 for WT and n = 4 for KO, with p=0.67, steps to −39 ± 5 mV WT and −35 ± 2 mV KO. (D) The rate of release to the −49 mV step declines equally in each genotype with increasing EGTA concentration: for 0.1 mM EGTA, n = 7 for WT and n = 6 for KO, p=0.323; for 1 mM EGTA n = 20 for WT and n = 22 for KO, p=0.99; and for 5 mM EGTA, n = 7 for WT and n = 6 for KO, p=0.235. (E,F) Box plots of the first component of release for depolarizations to −49 mV (E) or −44 mV (F). The effects of buffers were similar between the two groups.

