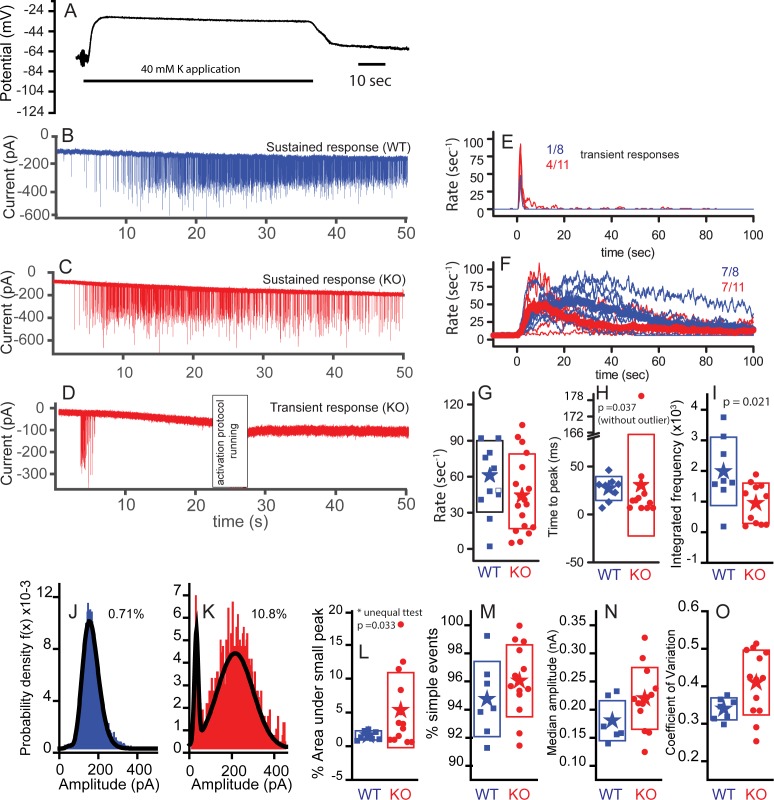
Figure 8. Subtle differences exist between WT and KO mice postsynaptic properties.
Postsynaptic bouton recordings were obtained from WT or KO in control and during application of 40 mM K+ to the bath. Hair cell recordings demonstrate similar depolarizations in WT and KO, suggesting that any differences in response properties may be synapticaly mediated. (A) Cells rapidly recovered following washout of K+. The solid line below the trace indicates the duration of the application. Postsynaptic recordings from afferent boutons in response to 40 mM K+ external solution application are presented in (B) for WT and (C) for KO with a sustained response and in (D) for KO with a transient response. Recordings were made in the presence of 5 µM tetrodotoxin (TTX). Frequency responses were generated using a 1 s window sliding at 100 ms intervals (E,F). Populations were defined as transient or sustained by according to whether firing persisted after 20 s. The number of each response type is presented as a fraction in each panel. Maximum frequency responses are presented in box plot format with mean values shown as stars (G); n = 10 for WT and n = 18 for KO, p=0.313. The time to peak is presented in (H), where onset of K+ application response was defined as the time point when the frequency exceeded the spontaneous frequency +3 x SD for two overlapping time windows (200 ms). The time to peak was statistically different when the one outlier was removed (time point at 181 s); n = 8 for WT and n = 10 for KO. Time to peak only includes fibers whose peak frequency reached 30 Hz, because those with lower peak frequencies had too few points to make an accurate measure. (I) Integrating the frequency response over 50 s shows that WT release in a more sustainable manner than the KO, n = 8 for WT and n = 10 for KO, p=0.021. Representative probability density functions for EPSC amplitudes are presented for WT (number of events = 6583) in (J) and for KO (number of events = 1551) in (K). Solid lines represent fits to either double Gaussian functions or Gaussian and gamma functions (smaller peak always fit with Gaussian function). The curves fitting the small events were integrated to measure the % of events under the small peak (shown next to each example). Only nerves that had at least 100 events are included to ensure the robustness of the fitting. (L) A box plot of the WT and KO percent of area contributed by the small peak. Comparisons using a t-test for unequal variance (Welch test) suggest a significant difference, p=0.032, n = 7 for WT and n = 13 for KO. (M) A box plot comparing the percentages of simple events, defined as single rise and decay times that are not significantly different, n = 7 for WT and n = 13 for KO, p=0.3. (N) Box plots of the median amplitude, where no significant difference was observed, n = 7 for WT and n = 13 for KO for each, p=0.105. (O) Box plots of the coefficient of variation for the distributions in (N). Plots were different, p=0.017, when equal variance was not assumed.

