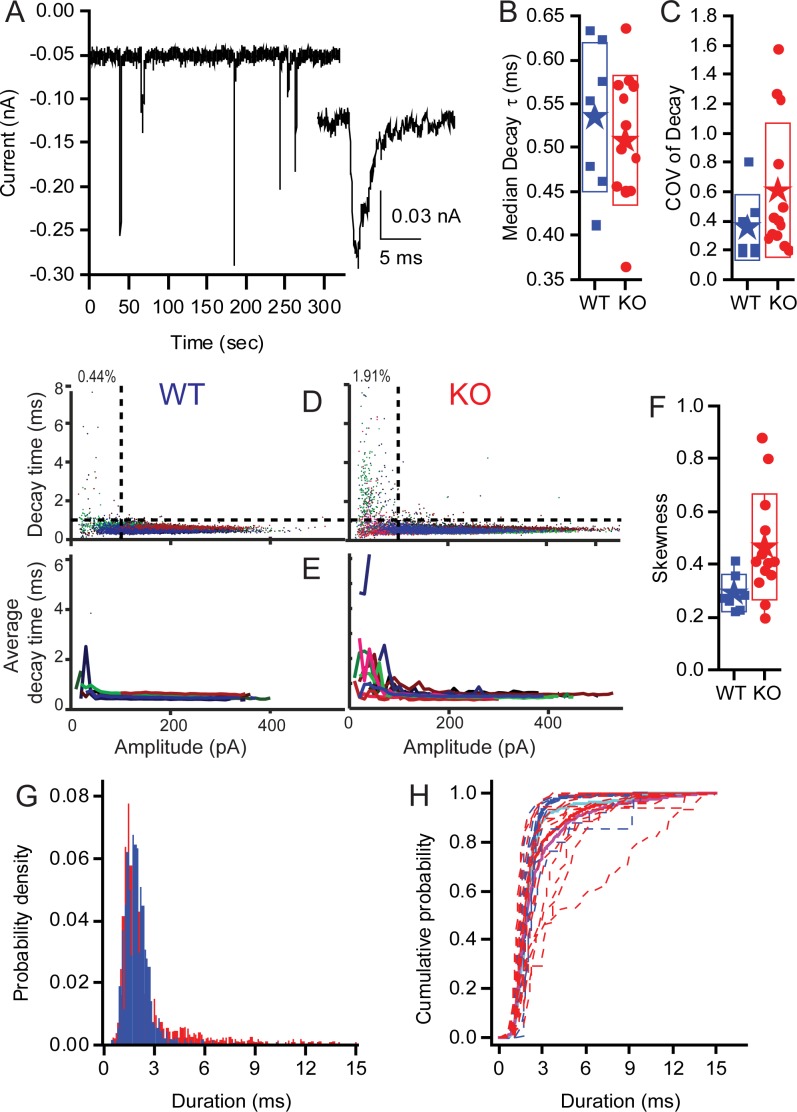
Figure 9. KO synapses have a larger population of small slow EPSCs.
Seven WT fibres including 15,564 events and 13 KO fibers including 17,210 events were analyzed. (A) Examples of EPSCs that range in amplitude and kinetics. The inset highlights one of the small slower EPSCs identified in KO fibers. Median decay times (B) and the Coefficients of Variation for the distribution in decay times (C) are presented as box plots. Neither population show a statistically significant difference between the WT and KO groups. (D) Plots showing the skewness of the distributions of decay times and demonstrating that the KO decay time is significantly greater (away from 0), suggesting that the mean is larger than median, largely because they have a long tail of large decay time. (E) Plot of the EPSC decay time constant for every fiber (each fiber a different color) for both WT and KO. (F) Summary of the data from (C) as average decay time constant with EPSCs binned over 10 pA. (G) Pooling fibers for WT and KO recordings allowed for the generation of a probability density function for event duration. These distributions are significantly different as shown by KS test (p<10−18). (H) The cumulative probability function for the duration of EPSCs. Dashed lines are the individual fiber distributions. Solid red and blue lines represent the population aggregate (summed responses) for KO and WT, respectively. The cyan and magenta lines are the averages for WT and KO, respectively.

