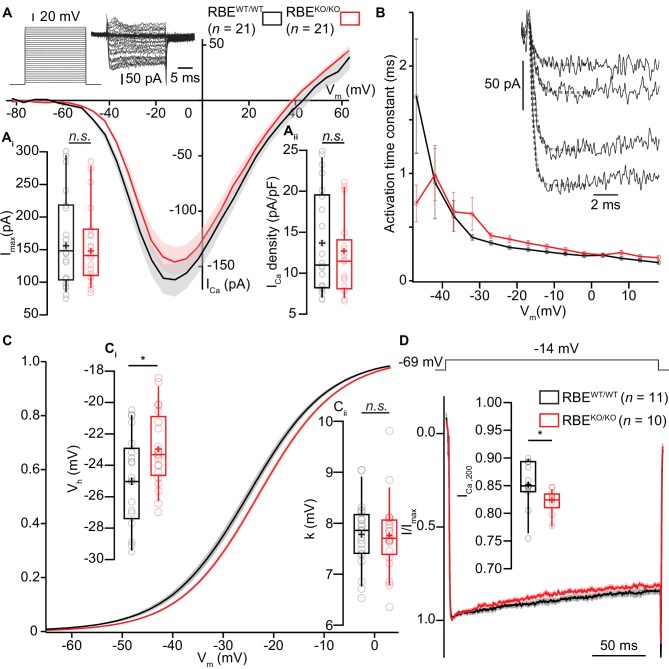
Figure 5. IHC Ca2+-influx shows normal amplitude but a mild depolarized shift in voltage-dependence.
(A) IV-relationship of the whole-cell Ca2+-current in RBEWT/WT (black, n = 21 cells, N = 8) and RBEKO/KO (red, n = 21 cells, N = 8) IHCs show comparable (sign-inverted) current amplitudes (Ai, p=0.62, t-test) and density (Aii, p=0.37, t-test.). Mean (line) ± S.E.M. (shaded areas) are displayed as for (C, D). The protocol, consisting of 20 ms steps of 5 mV from −82 to +63 mV, as well as exemplary resulting currents, aredisplayed in the left. Box plots show 10, 25, 50, 75 and 90th percentiles with individual data points overlaid, means are shown as crosses, as for (C, D). (B) Activation time constants (mean ± S.E.M.) of Ca2+-currents at different potentials were obtained by fitting a power exponential equation to the first 5 ms of the current traces, revealing no differences between conditions. (C) Fractional activation of the whole-cell Ca2+-current derived from the IV-relationships (A) was fitted to a Boltzmann function. (Ci) Box plots of the voltage for half-maximal activation Vh and Vh-estimates of individual IHCs show a depolarized shift of the fractional activation of the Cav1.3 Ca2+-channels in the RBEKO/KO IHCs (p=0.029, t-test). (Cii) Box plots of the voltage-sensitivity or slope factor k and k-estimates of individual IHCs illustrate comparable voltage sensitivity between both conditions (p=0.67, t-test). (D) Average peak-normalized Ca2+-currents resulting from 200 ms depolarizations to −14 mV. We observe an enhanced inactivation in ribbonless IHCs, quantified as a reduced residual Ca2+-current (inset). (n = 10 cells, N = 5 for RBEKO/KO and n = 11 cells, N = 7 in the RBEWT/WT; p=0.017, Mann-Whitney-Wilcoxon test).

