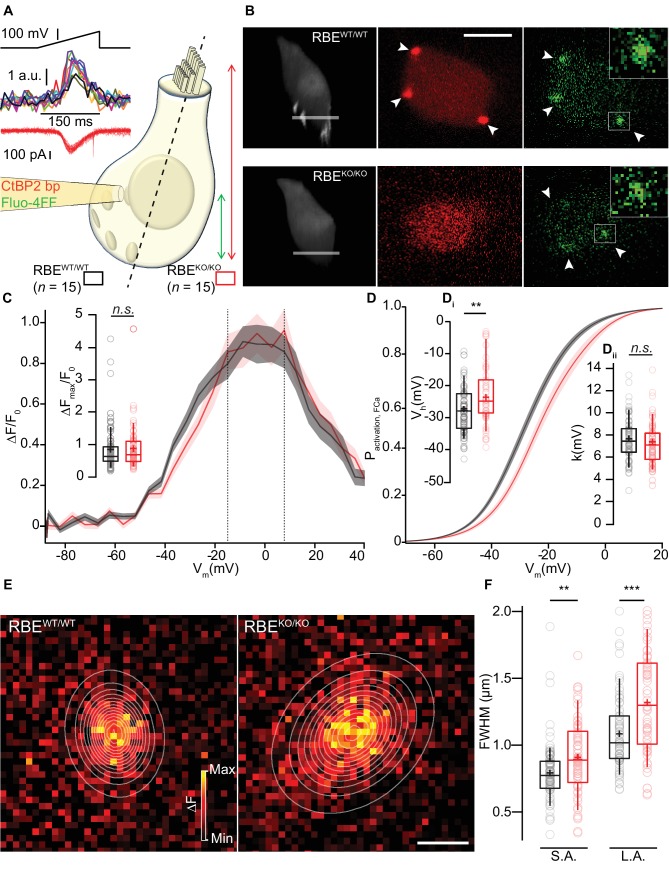
Figure 6. Synaptic Ca2+-influx shows normal amplitude but shifted voltage-dependence and broader spread.
(A, B) IHCs were patch-clamped at the modiolar basolateral face, loaded with TAMRA-CtBP2-binding peptide and the low affinity Ca2+-indicator Fluo-4FF, and scanned in the red channel after loading for 4 min to image TAMRA-labeled ribbons, nuclei, and cytosol. 3D projection of TAMRA fluorescence shows the absence of ribbons in RBEKO/KO IHCs (B: 3D projection and red channel). Voltage-ramps from −87 to +63 mV during 150 ms (A: left top) were used to trigger synaptic hotspots of Fluo-4FF fluorescence (A: left middle, 10 AZs in one exemplary RBEWT/WT IHC, B: green channel, marked by arrowheads; ΔF: average of the nine brightest pixels (red square)) and IHC Ca2+-influx (A, left bottom). Ca2+-imaging proceeded from the IHC bottom to the most apical ribbon in RBEWT/WT, and from IHC bottom to +12 µm (typically reaching the bottom of nucleus) in RBEKO/KO. Scale bar = 5 µm. (C) FV-relationship (ΔF/F0 vs. depolarization level in ramp, protocol as in A): approximating the voltage-dependence of synaptic Ca2+-influx.Mean (line) ± S.E.M. (shaded areas) are displayed as for (D). (Ci) ΔFmax/F0 was calculated by averaging 5 values at the FV-peak (between the dotted lines) and was comparable between RBEWT/WT (n = 78 AZs for 15 cells, N = 8) and RBEKO/KO IHCs (n = 61 AZs for 15 cells, N = 7) (p=0.20, Mann-Whitney-Wilcoxon test). Box plots show 10, 25, 50, 75 and 90th percentiles with individual data points overlaid, means are shown as crosses, as for (D, F). (D) Fractional activation curves derived from fits to the FV-relationships (C) were fitted to a Boltzmann function. Mean (line) ± S.E.M. (shaded areas) are displayed. (Di) The voltage for half-maximal activation Vh was significantly different between RBEWT/WT (n = 68 AZs for 15 IHCs, N = 8) and RBEKO/KO (n = 55 AZs for 15 IHCs, N = 7) AZs (p=0.0029, t-test), while the voltage-sensitivity or slope factor k (Dii) not (p=0.42, t-test). (E) Exemplary ΔF pictures of Fluo-4FF hotspots at RBEWT/WT (left) and RBE KO/KO (right) synapses fitted and overlaid by 2D-Gaussian functions to estimate spatial extent as full width at half maximum (FWHM) for the short axis (S.A.) and the long axis (L.A.). Scale bar = 1 µm. (F) Ribbonless synapses of RBEKO/KO IHCs showed a greater spatial spread of the Fluo-4FF fluorescence change. FWHM calculated from the Gaussian fitting to the Fluo-4FF fluorescence hotspot was larger for both axes in RBEKO/KO (n = 61 AZs for 15 IHCs, N = 8) compared to RBEWT/WT (n = 74 AZs for 15 IHCs, N = 7) (L.A.: p=0.00016; S.A.: p=0.0029, t-test).


