. 2018 Feb 1;7:e31529. doi: 10.7554/eLife.31529

Figure 5. Size exclusion chromatography of L. blandensis RNR in the absence and presence of 3 mM ATP or 0.5 mM dATP.

Proteins at concentrations of 20 μM each were pre-incubated separately or mixed together for 10 min at room temperature in the absence (black dotted line) or presence of ATP (blue dashed line) or dATP (red solid line), centrifuged and applied to the column equilibrated with SEC buffer at 7°C. Panels show NrdB (a), NrdA (b), and an equimolar mixture of NrdA and NrdB (c). C Insert: SDS PAGE of the eluted proteins run in the presence and absence of the indicated effectors. Elution positions of fractions applied to gel are indicated by red (in the presence of dATP) and blue (in the presence of ATP) arrows, respectively. (d) Summary of multiple SEC experiments varying protein concentrations of NrdA (10–113 μM), NrdB (5–150 μM) and mixtures of NrdA and NrdB at ratios of 1:1 or 1:2. Molecular masses and standard deviations are calculated for 3–5 experiments, and closest estimated complex stoichiometry are shown in parenthesis, with major species underlined when appropriate (see Figure 5—figure supplement 1 for details).

Figure 5.

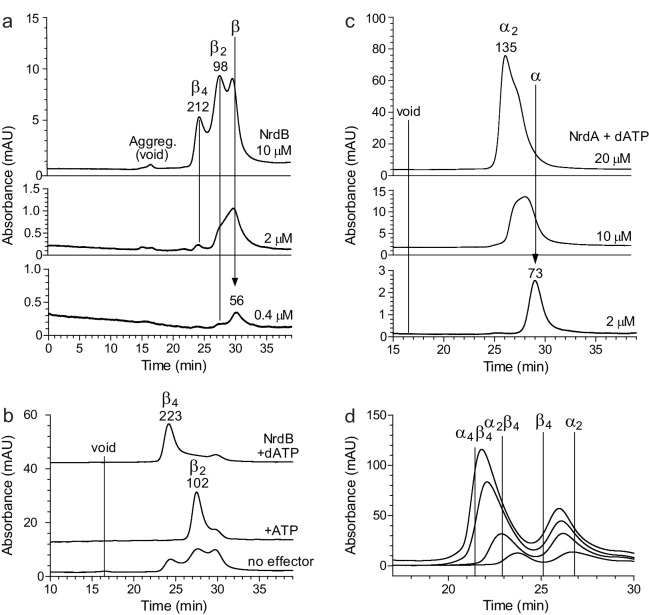
Figure 5—figure supplement 1. Size exclusion chromatography studies of the L. blandensis NrdA and NrdB at low protein concentration.

Figure 5—figure supplement 1.

(a) NrdB analyzed at different protein concentrations (in µM) shows that the protein gradually changes from monomers to dimers and to some extent tetramers. (b) NrdA analyzed in the presence of 100 µM dATP gradually changes from monomers to dimers when the protein concentration increases. At the intermediate protein concentrations, the protein peak is between monomers and dimers due to the equilibration between the two forms. (c) NrdB (10 µM) forms a tetramer in the presence of 100 µM dATP, dimer in the presence of ATP and a mixture of monomers, dimers and tetramers in the absence of allosteric effectors. The experiment without allosteric effectors is the same as the top spectrum in (a). (d) Mixtures of NrdA and NrdB were analyzed at different protein concentrations (5, 10, 20 and 30 µM of each subunit) in the presence of 100 µM dATP. The experiments were performed on a Superdex 200 10/300 GL column (GE Health Care) at room temperature with a running buffer consisting of 150 mM KCl, 10 mM MgCl2 and 50 mM Tris-HCl pH 7.6. The KCl concentration was kept at 150 mM except in (d), where the concentration needed to be reduced to 50 mM to avoid inhibition of the NrdA-NrdB interaction.