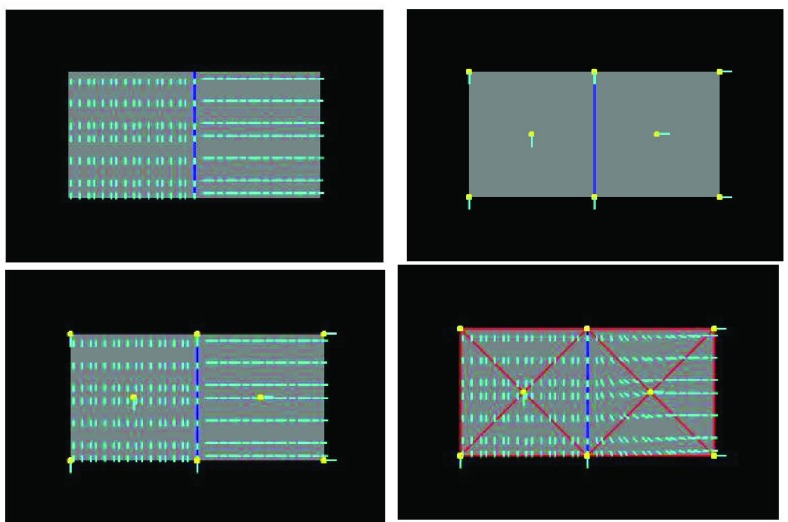
FIGURE 2.
Comparison of fiber fitting results between FEM and EFGM. Top left: A composite object formed by two materials with different fibreous components, with the blue line indicating the interface (the ground truth). Top right: The 8 nodes (yellow) with fiber orientations (cyan) used for FEM interpolation or EFGM approximation. Bottom left: Fiber fitting result of EFGM, using the 8 nodes (yellow) meshfree representation. Bottom right: Fiber fitting result of FEM, using the 8 nodes (yellow) mesh (red).

