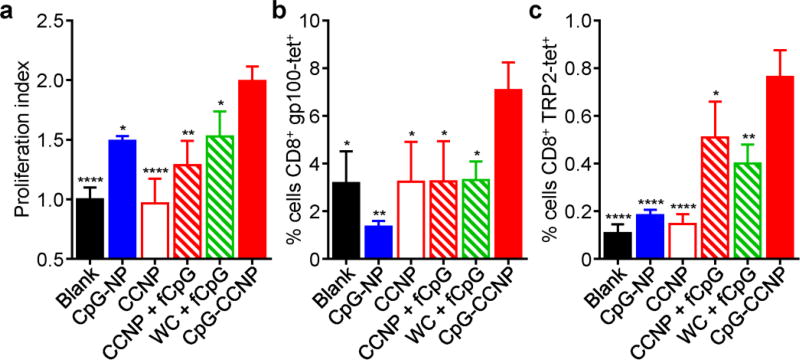
Figure 5.
Characterization of in vivo T cell responses. a) Proliferation index of adoptively transferred pmel-1 CD8+ T cells after in vivo stimulation by CpG-CCNPs or various control formulations, including whole cell lysate with free CpG (WC + fCpG), CCNPs with free CpG (CCNP + fCpG), CCNPs, CpG-NPs, and blank solution (n = 3; mean ± SD). b,c) Tetramer staining analysis of T cells specific for gp100 (b) and TRP2 (c) after ex vivo restimulation of splenocytes from mice vaccinated with CpG-CCNPs or various control formulations (n = 3; mean ± SD). * p < 0.05, ** p < 0.01, **** p < 0.0001 (compared to CpG-CCNP); one-way ANOVA.

