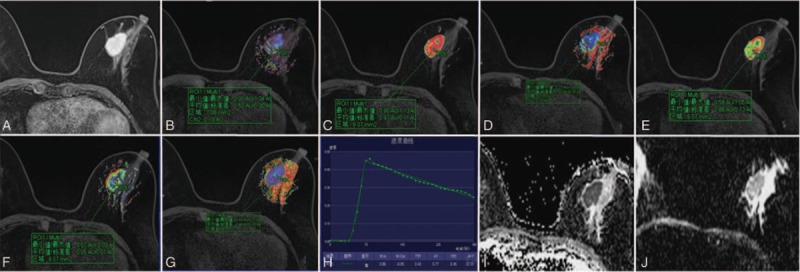
Figure 1.

Representative MR images from a patient with infiltrating ductal carcinoma (grade III). (A) TWIST-DCE image. (B–G) pseudocolor images for Ktrans (B), Kep (C), Ve (D), W-in (E), W-out (F), and TTP (G). Red represents high values, yellow intermediate values, and blue low values. The values for Ktrans, Kep, Ve, W-in, W-out, and TTP were 0.50 min−1, 0.99 min−1, 0.45, 0.86 min−1, −0.05 min−1, and 0.43 minutes, respectively. (H) Concentration–time curve for the ROI. (I) ADC image for RESOLVE-DWI. (J) ADC image for conventional EPI-DWI. ADC = apparent diffusion coefficient, DCE = dynamic contrast-enhanced, EPI = echo-planar imaging, Kep = transport rate describing the return of the contrast agent from the extravascular–extracellular space to the blood plasma, Ktrans = rate of contrast agent transport from the blood plasma to the extravascular–extracellular space, MR = magnetic resonance, RESOLVE-DWI = readout segmentation of long variable echo-trains diffusion-weighted magnetic resonance imaging, ROI = region of interest, TTP = time-to-peak enhancement after contrast agent injection, TWIST = time-resolved angiography with interleaved stochastic trajectories, Ve = fractional volume of the extravascular–extracellular space in the tissue, W-in = rate of contrast enhancement for contrast agent inflow, W-out = rate of contrast decay for contrast agent outflow.
