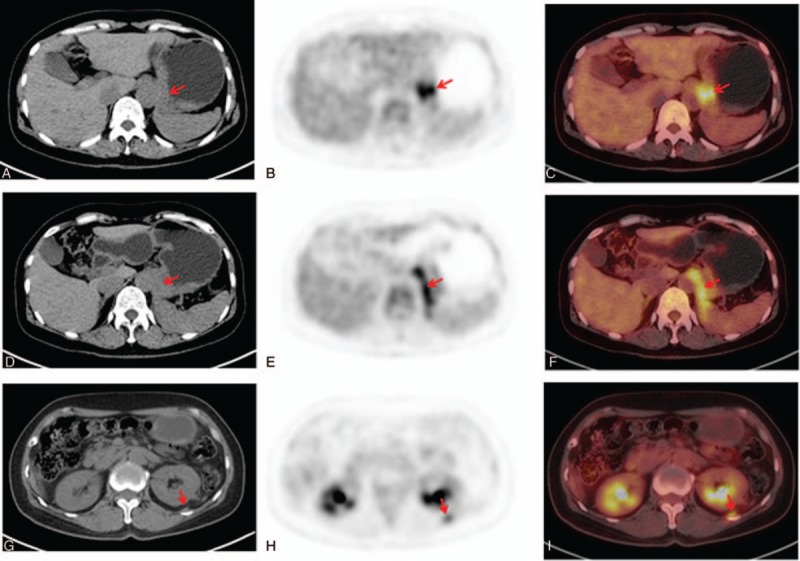
Figure 2.

Axial low-dose CT (left), PET (center), and fused PET/CT (right) images showed that there was intense FDG uptake in both thickening gastric cardia with an SUVmax of 5.7 (A, B, C) and thickening left diaphragmatic crura with an SUVmax of 6.3 (D, E, F). Meanwhile, localized thickening of left retroperitoneala had mild 18F-FDG uptake with a SUVmax of 2.8 (G, H, I) (arrow). FDG = fluoro-2-deoxy-d-glucose, PET/CT = positron emission tomography/computed tomography, SUVmax = maximum standardized uptake value.
