Fig. 1.
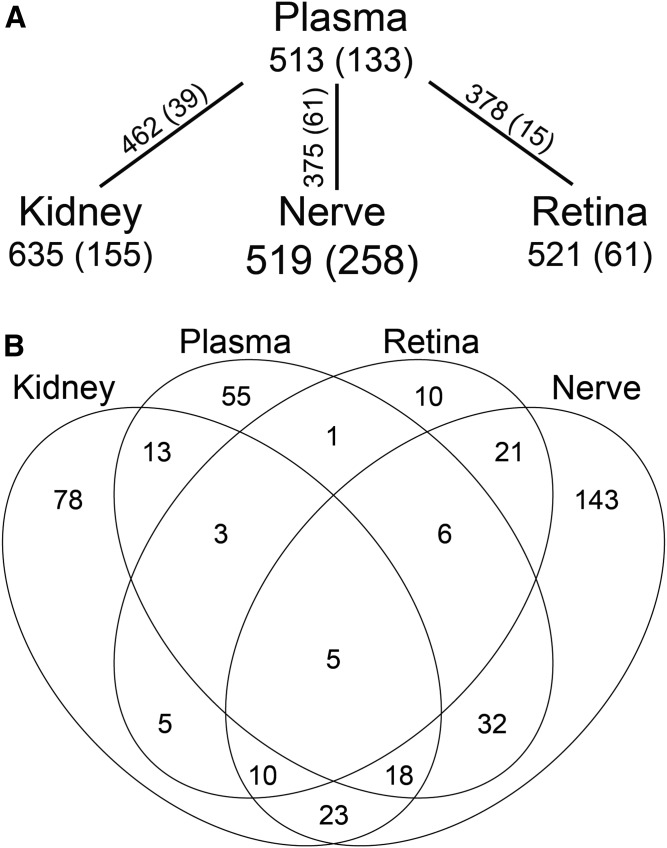
Overlap of differential lipid changes in diabetic mouse plasma, kidney, nerve, and retina. A: Shotgun lipidomics identified over 500 lipids in each plasma, kidney cortex, sciatic nerve, and retina from 24-week-old diabetic versus control mice. Shown are the number of lipids identified in each tissue and the number (in parentheses) that differed between control and diabetic conditions. The numbers of unique features shared between plasma and each tissue are shown on the connecting line, followed by those (in parentheses) that were significantly different between control and diabetic conditions in both plasma and each tissue. B: Venn diagram of significantly altered lipid features between control and diabetic mice in plasma, kidney cortex, sciatic nerve, and retina. P < 0.01 based on a two-sample t-test with FDR correction, n = 10 per group.

