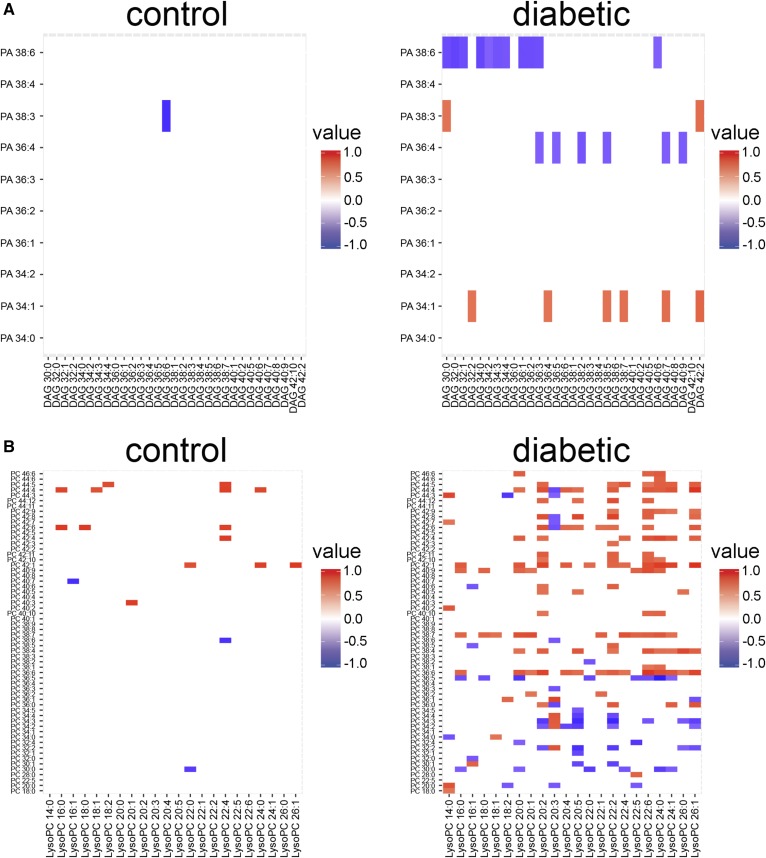
Fig. 2.
Class-specific correlation analysis in the control and diabetic mouse kidneys for integration with transcriptomic data. Zoom-in views of correlations between PA and DAG lipid classes (A) and PC and LPC lipid classes (B) in kidney cortex from 24-week-old control and diabetic mice. Significant correlations are shown as positive (red) or negative (blue). P < 0.1 using Pearson’s correlation with Fisher’s transformation and FDR correction, n = 10 per group. Corresponds to supplemental Fig. S3B.

