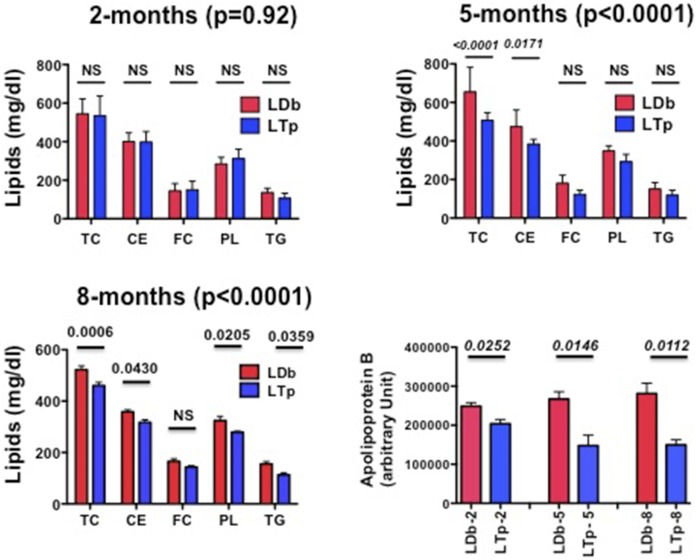
Fig. 2.
Comparison of plasma lipids and apoB levels in C57BL/6, LDb, and LTp male mice at 2, 5, and 8 months of age. The concentrations of plasma TC, CE, FC, PLs, TG, and apoB in C57BL/6, LDb, and LTp male mice at 2, 5, and 8 months of age (n > 7 animals) are presented as mean ± SD. Statistical analysis on lipids was performed using a two-way ANOVA test, followed by a post hoc test with Bonferroni correction to obtain the P for each age category and individual lipids. The Ps are listed. We used two-tailed unpaired t-tests with Welch’s correction to analyze the comparison of apoB between LDb and LTp mice. The Ps are listed. P < 0.05 was considered statistically significant.

