Fig. 3.
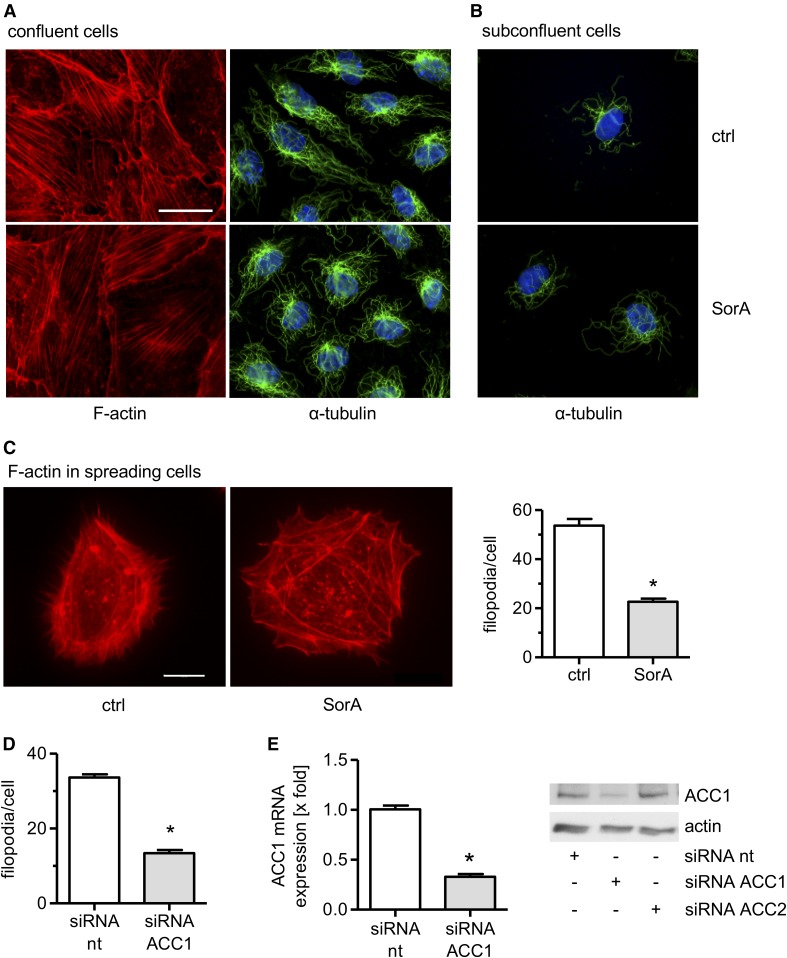
ACC inhibition decreases the number of filopodia in migrating ECs. HUVECs were grown to confluency (A) or in low density (B) and were treated with soraphen A (SorA) (30 μM, 24 h). F-actin (red), α-tubulin (green), and nuclei (blue) were visualized by immunocytochemistry and fluorescence microscopy. Magnification: 64×. The scale bar represents 25 μm. One representative image out of three independently performed experiments is shown. C: HUVECs were left untreated or treated with soraphen A (30 μM, 24 h), detached, and allowed to spread at low density for 2 h. D: HUVECs were treated with nontargeting (nt) or ACC1-targeting siRNA. Forty-six hours after transfection, cells were allowed to spread at low density for 2 h. C: Magnification: 64×. The scale bar represents 10 μm. One representative image out of three independently performed experiments is shown. C, D: F-actin (red) was visualized by immunocytochemistry and fluorescence microscopy. The number of filopodia was quantified by counting. Data are expressed as mean ± SEM (n = 3) [*P ≤ 0.05 vs. control (ctrl) or siRNA nt]. E: Gene silencing controls. HUVECs were transfected with nontargeting (nt) siRNA, ACC1-targeting siRNA, or ACC2-targeting siRNA. Forty-eight hours after transfection, ACC1 mRNA levels were analyzed by qPCR. ACC1 and β-actin protein levels were determined by Western blot analysis. Data are expressed as mean ± SEM (n = 3) (*P ≤ 0.05 vs. siRNA nt). One representative image out of three independently performed experiments is shown.

