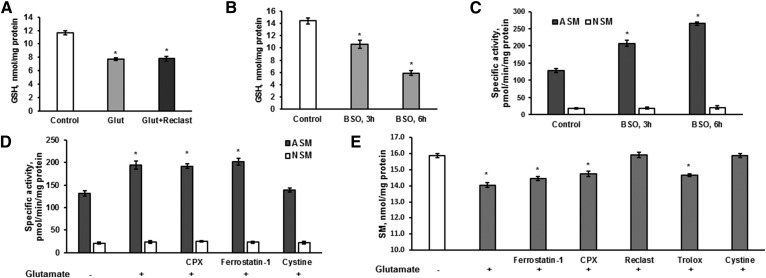
Fig. 6.
ASM activation in response to glutamate is controlled by intracellular GSH in OLs. A: OLs were treated with 1 mM glutamate with/without the ASM inhibitor, Reclast (25 μM), for 6 h and GSH content was quantified. Data are mean ± SE, *P < 0.05, n = 8. B: OLs were exposed to 500 μM BSO and GSH content was determined. Data are mean ± SE, *P < 0.05, n = 8. C: OLs were treated with 500 μM BSO and specific ASM and NSM activity changes were determined. The enzyme activity is expressed as picomoles of C15-SM per minute per milligram protein. Data are mean ± SE, *P < 0.05, n = 12. D: OLs were exposed to 1 mM glutamate with/without the ferroptosis inhibitor, ferrostatin-1 (5 μM), the iron chelator, CPX (5 μM), or 1 mM cystine for 6 h. ASM and NSM specific activity was measured. The enzyme activity is expressed as picomoles of C15-SM per minute per milligram protein. Data are mean ± SE, *P < 0.05, n = 12. E: OLs were exposed to 1 mM glutamate with/without the ferroptosis inhibitor, ferrostatin-1 (5 μM), the iron chelator, CPX (5 μM), the radical scavenger, trolox (15 μM), the ASM inhibitor, Reclast (25 μM), or 1 mM cystine for 24 h. SM content changes were measured. Data are mean ± SE, *P < 0.05, n = 12. Each sample was normalized to its respective total protein levels.

