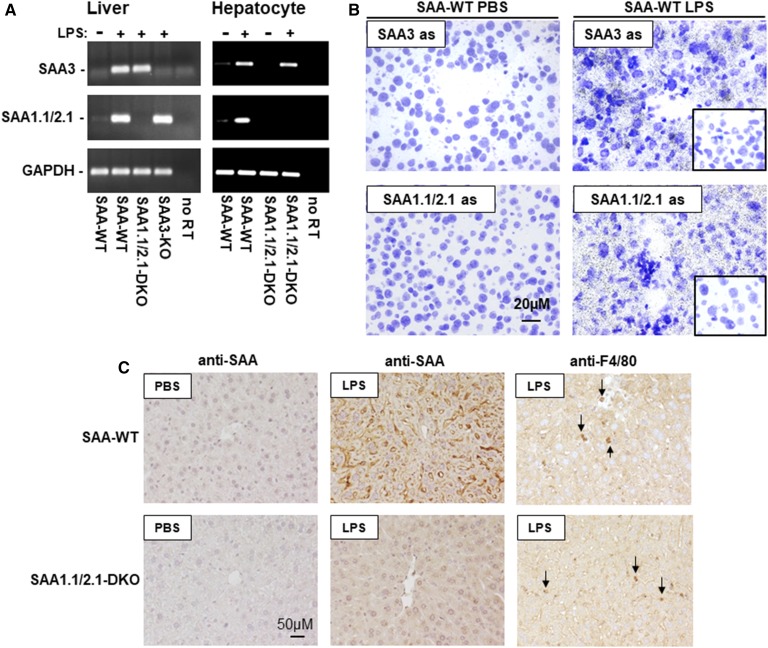
Fig. 1.
SAA 1.1/2.1 and SAA3 in mouse liver. A: Total RNA was isolated from the livers of noninjected SAA-WT mice, and SAA-WT, SAA1.1/2.1-DKO, and SAA3-KO mice injected with 100 μg LPS, as well as primary hepatocytes isolated from SAA-WT and SAA1.1/2.1-DKO mice injected with 25 μg LPS or PBS, as indicated. RT-PCR was performed using primers specific for SAA3 and SAA1.1/2.1. B: High-resolution bright-field images of emulsion-coated liver sections from PBS- or LPS-injected SAA-WT mice hybridized with SAA3- or SAA1.1/2.1-anti-sense probes. Inserts in the right-hand panels represent hybridization of SAA3- or SAA1.1/2.1-sense probes to liver sections of an LPS-injected SAA-WT mouse. Magnification, 40× scale bar, 20 μM; exposure times, 5 days for SAA1.1/2.1 and 30 days for SAA3. C: Immunostaining of liver sections from a SAA-WT or SAA1.1/2.1-DKO mice injected with either PBS or LPS (25 μg), as indicated, using antibodies that detect SAA1.1/2.1 and SAA3 (anti-SAA) or macrophages (anti-F4/80). Images were photographed under 20× objective magnification (scale bar, 50 μM). Arrows in the right panels indicate immunopositive staining for F4/80 (red/brown chromogen).

