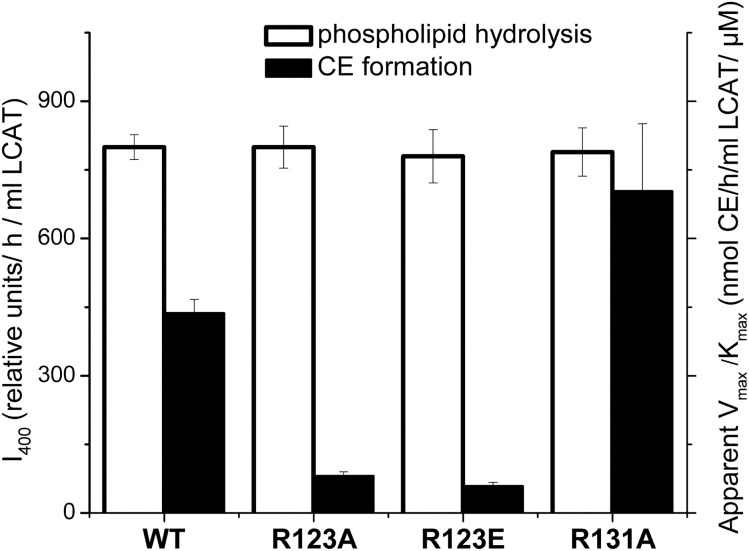
Fig. 4.
Effect of the apoA-I mutations on LCAT phospholipid hydrolysis and CE formation. rHDLs made with WT apoA-I or one of the apoA-I mutants were used as a substrate for the assays to assess phospholipid hydrolysis and CE formation by LCAT. Values were calculated as the mean ± SD of at least three independent measurements. Phospholipid hydrolysis was assessed by measuring fluorescence of monomeric labeled fatty acids produced by hydrolysis of dual-labeled POPC (1 μM) following the incubation of rHDL (15 μg of POPC) with purified LCAT, as described in the Materials and Methods. The relative values for LCAT phospholipid hydrolysis (white bars) are expressed in the relative fluorescence intensity at 400 nm, I400, normalized by the incubation time and the amount of LCAT (left y axis). CE formation was measured in the assays as described for Fig. 3. The values for the apparent catalytic efficiency for CE formation, Vmax/Km, (listed in Table 3) were determined from Lineweaver-Burk double reciprocal plots generated from the assay data. The values for the apparent Vmax/Km (black bars) are expressed in nanomoles of CE formed per hour of incubation per milliliter of LCAT per μM of substrate cholesterol (right y axis).

