Figure 1.

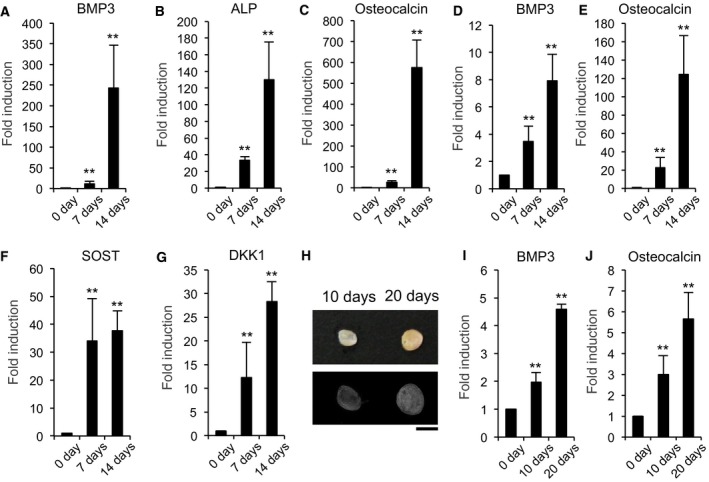
The expression of BMP3 increases with OB differentiation. BMSCs (A–C) and primary calvarial OBs (D–G) were treated with OB differentiation medium containing 50 μg·mL−1 ascorbic acid and 10 mm β‐glycerophosphate. The messenger RNA levels of BMP3 (A, D), ALP (B), OC (C, E), SOST (F), and DKK1 (G) were determined by qPCR on 0, 7, or 14 days (A–G). One microgram of BMP2 was implanted subfacially to induce ectopic bone formation in wild‐type mice (each time course n = 4). After 0, 10, or 20 days, the implants were removed and examined using soft X‐ray analysis. Represented pictures were shown. Scale bar corresponds to 5 mm (H). After 0, 10, or 20 days, the implants were determined for the expression levels of BMP3 (I) and OC (J) by qPCR. The data are expressed as the mean ± SD (n = 3). **P < 0.01, versus 0 day.
