Figure 2.

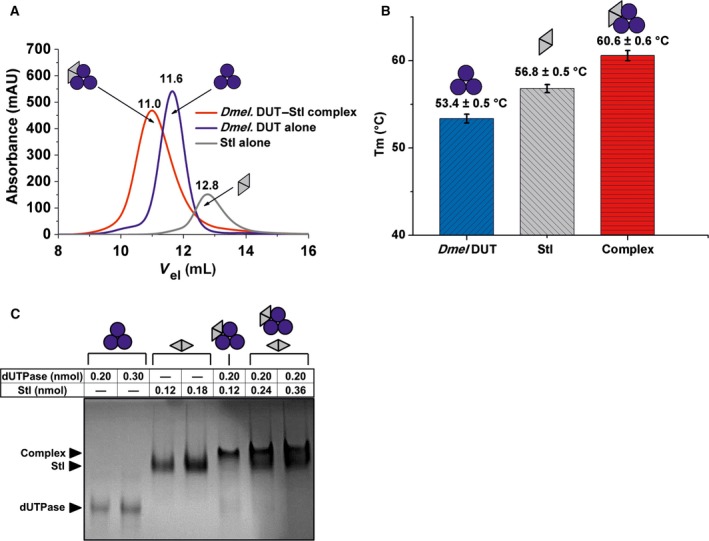
Complex formation between Drosophila melanogaster dUTPase and Stl. Color code: Blue circles and gray triangles indicate D. melanogaster dUTPase monomers and Stl monomers, respectively. Pictograms indicate their respective oligomer assembly. (A) Size exclusion chromatography. Blue line stands for dUTPase, gray line for Stl, and red line for their complex elution peak. Numbers above the lines show exact peak elution volumes for better comparison. (B) DSF. Bar graph shows melting points of the separate proteins and their complex. Means and standard deviations are indicated on the graph. (C) Native polyacrylamide gel electrophoresis. Names with black arrows on the left of the gel identify the different protein bands. The table on the top shows the molar amounts of proteins. Two separately drawn pictograms stand for two distinct protein bands within one lane.
