Figure 3.

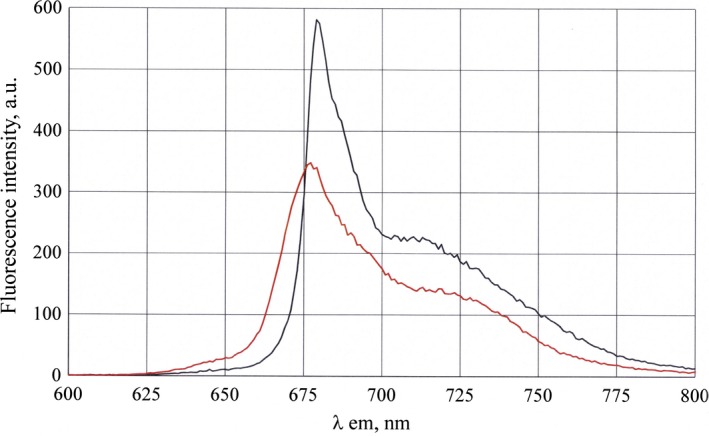
Fluorescence spectra of Ce6 (red curve, λmax = 677 nm, fluorescence intensity (FI) = 345) and Ce6 embedded into phospholipid nanoparticles (black curve, λmax = 680 nm, FI = 575) in PBS (pH 7.4). Excitation wavelength λex = 675 nm.

Fluorescence spectra of Ce6 (red curve, λmax = 677 nm, fluorescence intensity (FI) = 345) and Ce6 embedded into phospholipid nanoparticles (black curve, λmax = 680 nm, FI = 575) in PBS (pH 7.4). Excitation wavelength λex = 675 nm.