
Figure 2.
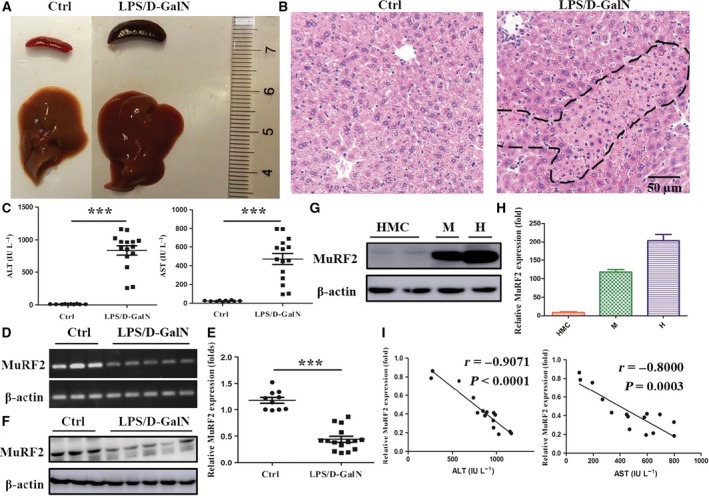
MuRF2 expression decreases in HMCs of LPS/d‐GalN‐treated mice and is inversely correlated with serum ALT and AST content. Mice were killed after being administered with i.p. LPS and d‐GalN for 8 h. (A) Gross images of liver and spleen. (B) The liver tissue was embedded, sliced and stained with hematoxylin and eosin and photographs were obtained with an optical microscope (the dashed line shows liver tissues necrosis area; ×100 original magnifications). (C) The serum levels of ALT or AST were determined. (D,E) Semiquantitative (D) or quantitative (E) PCR was performed to determine MuRF2 expression in HMCs of LPS/d‐GalN‐treated mice. β‐Actin was an internal normalized reference. (F,G) Western blot was used to detect MuRF2 expression in HMCs, muscle (M) and heart (H) in mice. β‐Actin was an internal normalized reference. (H) Quantitative PCR were performed to determine MuRF2 expression in HMCs, muscle (M) and heart (H) of mice. (I) The correlation was determined between MuRF2 mRNA expression in HMCs and serum ALT or AST levels. Each data point represents one mouse. ***P < 0.001.