
Figure 5.
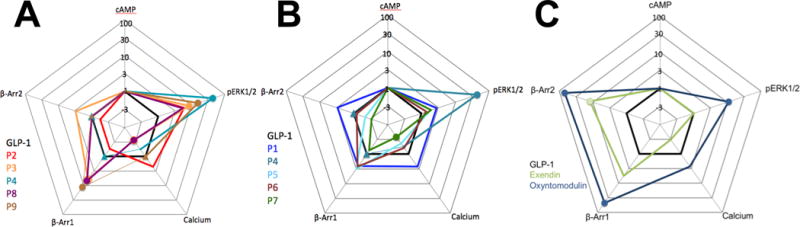
Webs of bias for α- and α/β-peptides P1 – P9 (A, B) and known biased agonists exendin-4 and oxyntomodulin9 (C) relative to GLP-1 in FlpInCHO cells stably expressing the human GLP-1R. Circles represent data that are significantly biased. Triangles represent data where no value could be defined. The τ/KA ratio extracted from standard concentration-response data is used to calculate bias factors (ΔΔ(τ/KA) through normalization of the transduction coefficient (τ/KA) to a reference ligand (GLP-1) and reference pathway (cAMP accumulation).