
Fig. 4.
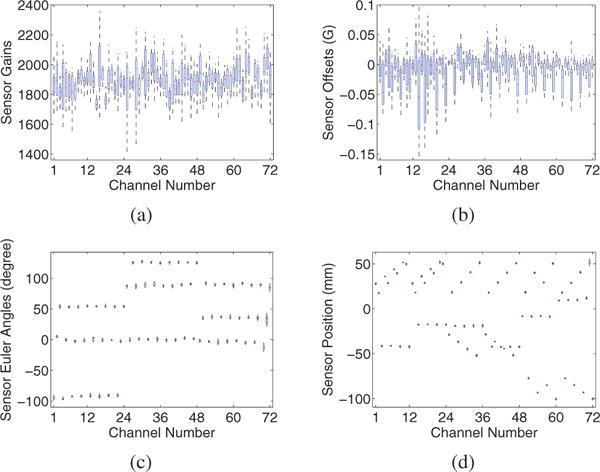
Distributions of the estimated sensor parameters: (a) gains, (b) offsets, (c) Euler angles, (d) positions, across 15 data sets for each of the 72 channels. The middle line, the bottom, and the top of the box represent the median, the 25th, and the 75th percentiles, respectively. The whiskers represent the furthermost value in the 1.5 interquartile ranges. Outliers are not represented in this figure.