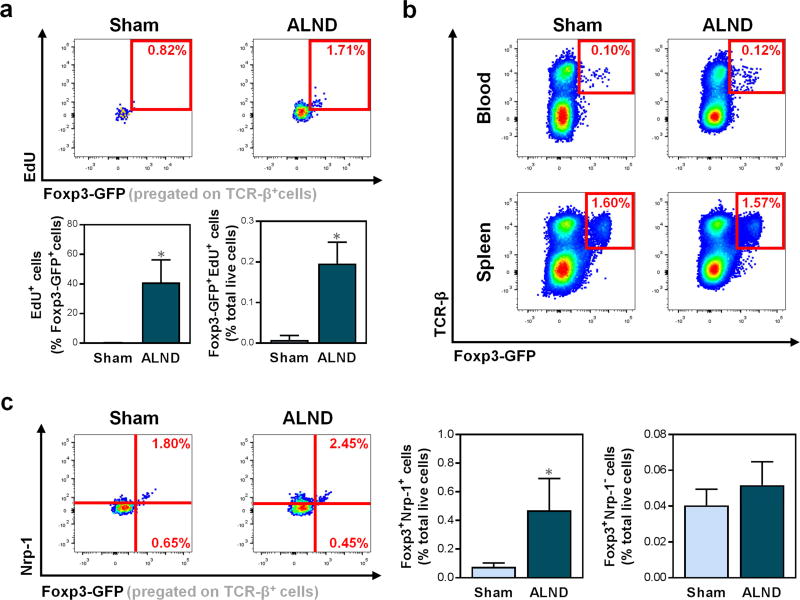
Figure 2. Lymphatic injury increases proliferation and activation of natural Tregs.
a) Representative FACS plots (upper) and quantification (lower) of proliferating (EdU+) TCR-β+Foxp3-GFP+ Tregs in mouse forelimbs (n=6/group).
b) Representative FACS plots of TCR-β+Foxp3-GFP+ Tregs in mouse blood (upper) and spleens (lower).
c) Representative FACS plots (left) and quantification (right) of TCR-β+Foxp3-GFP+Nrp-1+ nTregs and TCR-β+Foxp3-GFP+Nrp-1− iTregs in mouse forelimbs (n=5/group).
Mice harvested six weeks after surgery. Data expressed as mean ± SD. Statistically significant differences represented by *P<0.05, **P<0.01, and ***P<0.001. nTregs, natural Tregs; iTregs, induced Tregs.

