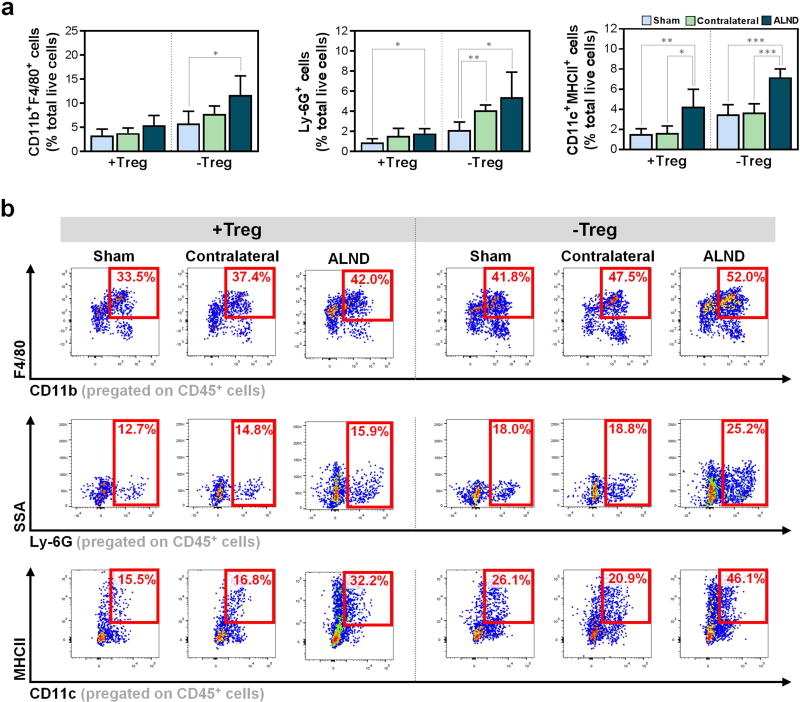
Figure 4. Tregs regulate leukocyte infiltration following lymphatic injury.
a) FACS quantification of CD11b+F4/80+ macrophages (left), Ly-6G+ neutrophils (middle), and CD11c+MHCII+ DCs (right) (n=4–6/group).
b) Representative FACS plots of CD45+CD11b+F4/80+ macrophages (top), CD45+Ly-6G+ neutrophils (middle), and CD45+CD11c+MHCII+ DCs (bottom).
Data expressed as mean ± SD. Statistically significant differences represented by *P<0.05, **P<0.01, and ***P<0.001.

