Figure 1.
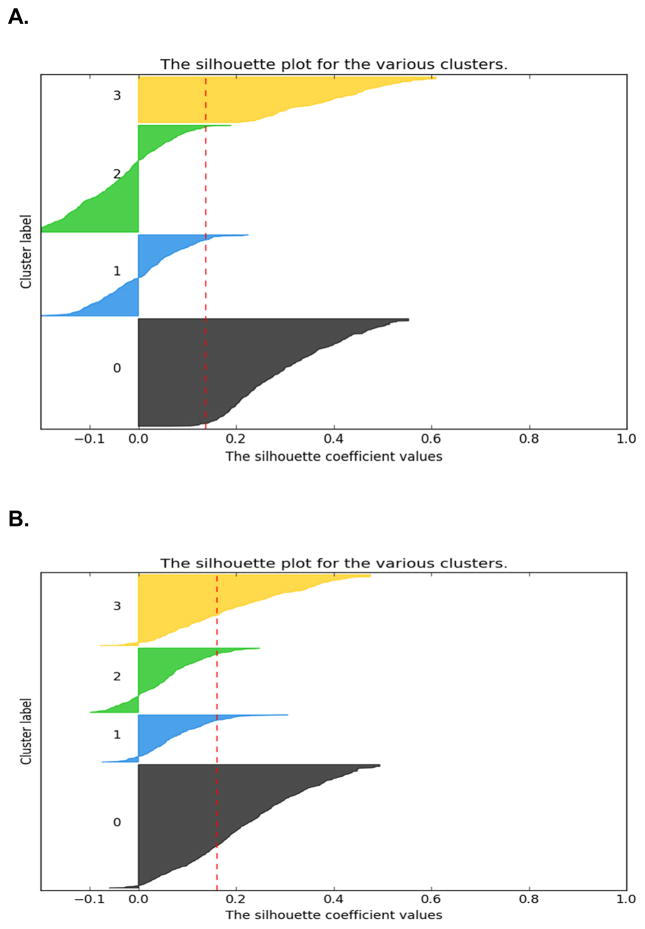
Figure 1A. Silhouette coefficient diagram for the 4-class solution using latent class analysis. The sizes of the clusters in the diagram are proportional to their size inside the total sample of patients (n=1329). The labels represent the following clslusters: 0 (All Low (n=419, 31.5%)), 1 (Moderate Physical & Lower Psychological (n=316, 23.8%)), 2 (Moderate Physical & Higher Psychological (n=416, 31.3%)) and 3 (All High (n=178, 13.4%).
Figure 1B. Silhouette coefficient diagram for the 4-cluster solution using the K-modes analysis. The sizes of the clusters in the diagram are proportional to their size inside the total sample of patients (n=1329). The labels represent the following clusters: 0 (All Low (n=536, 40.3%)), 1 (Moderate Physical & Lower Psychological (n=205, 15.4%)), 2 (Moderate Physical & Higher Psychological (n=280, 21.1%)), and 3 (All High (n=308, 23.2%)).

