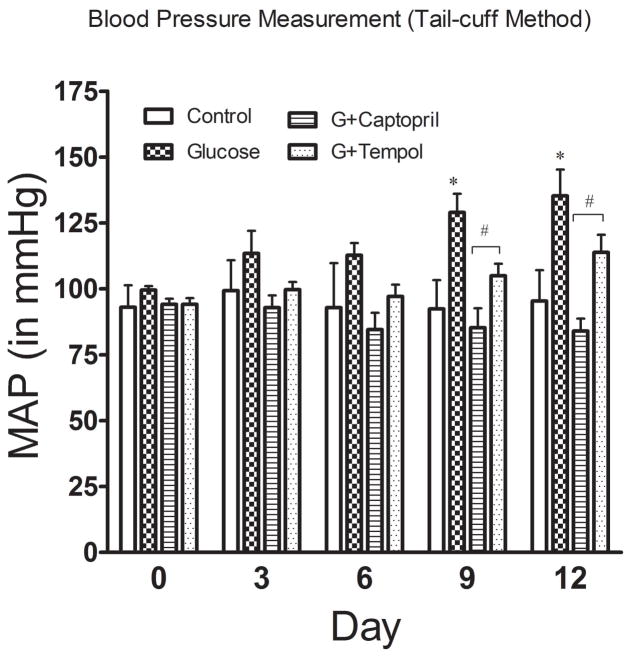
Fig. 3.
Blood pressure measurement. Blood pressure was measured via tail cuff plethysmography for each of the groups (control, glucose, G+captopril, and G+tempol treated groups, n=6). Values are expressed as mean ± SD. *P <0.05, and #P <0.05 for the glucose vs control, and glucose vs G+captopril, G+tempol treated groups on day 0, day 3, day 6, day 9, and day 14 (Two-way ANOVA followed by Bonferroni posttests). When time factor was considered, the BP change was not significant at day 3 and 6 for all groups but captopril. However, BP change was significant in only day 6 for control vs glucose, and glucose vs G+tempol groups when tested individually using student’s t-test.

