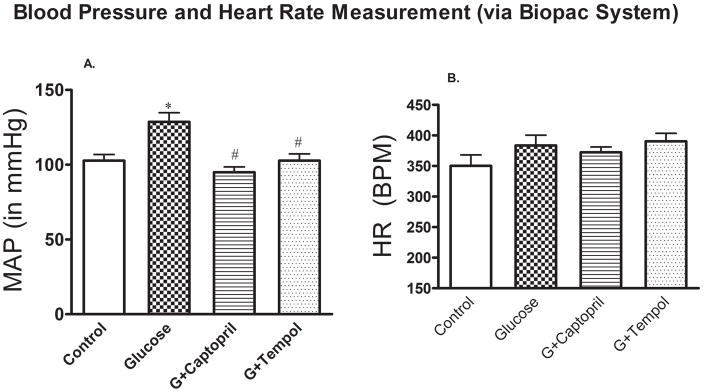
Fig 4.
A. In-line mean arterial pressure (MAP) and B. heart rate (HR) measurement. Values are expressed as mean ± SD. *P < 0.05, and #P < 0.05 for the control vs glucose, and glucose vs G+captopril, G+tempol treated group, respectively (one-way ANOVA followed by Tukey-Kramer posttests). B. Heart rate: There was no significant difference in HR between all groups.

