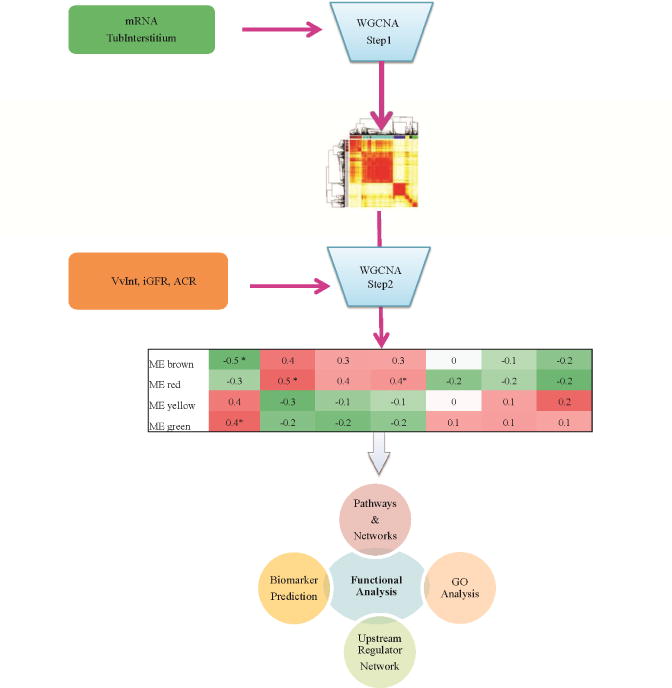
Figure 1.

Schematic representation of the study design to identify VvInt associated co-expressed modules and long-term clinical outcome. In Step 1, modules or groups of genes with similar expression profiles are constructed from the transcriptome profile using a Weighted Gene Coexpression Analysis strategy. In Step 2, module eigengene (ME) is derived from each module and associated to clinical and structural parameters. The heatmap table illustrates the correlation coefficients of the module eigengene to the tested parameters. The significant modules (represented with asterisks) are then further investigated for functional enrichments.
