Figure 1.
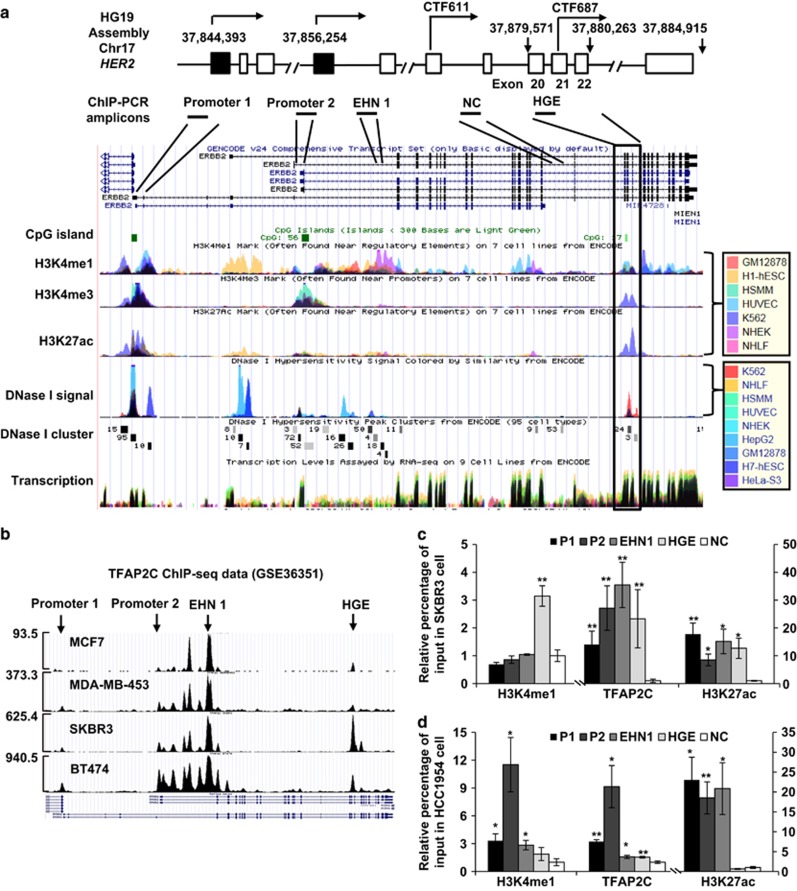
Epigenetic demarcation of the HGE. (a) Top: schematic illustration of the locations of the HER2 promoters (1 and 2), two C-terminal transcripts (CTF611 and CTF687), and the HGE region, as well as the exon composition of HER2, based on UCSC gene annotation (GRCh37/hg19). Bottom: enrichment of H3K4me1, H3K4me, H3K27ac and DNase I hypersensitivity signals, retrieved using the ENCODE Regulation Super-track Settings. Colors representing different cell types are shown in the legend. Chromatin immunoprecipitation (ChIP)-PCR amplicons are shown. NC: sequences to which nonspecific controls were generated. (b) Profile of TFAP2C binding to the HER2 gene in the indicated cell lines, as retrieved from ChIP-seq data (GSE36351). The maximum reads on the y axis represent normalized coverage (reads per million mapped). (c, d) TFAP2C binding and H3K4me1 and H3K27ac modification, in SKBR3 (c) and HCC1954 (d) cells, as assessed by ChIP. Enrichment was interpreted as a percentage of input. Fold change over input normalized to NC is shown. P1, HER2 promoter 1; P2, HER2 promoter 2; EHN1, intron 1 enhancer. Mean±s.d. was determined for three independent experiments, and the Student's t-test was used to calculate the significance. *P<0.05, **P<0.001.

