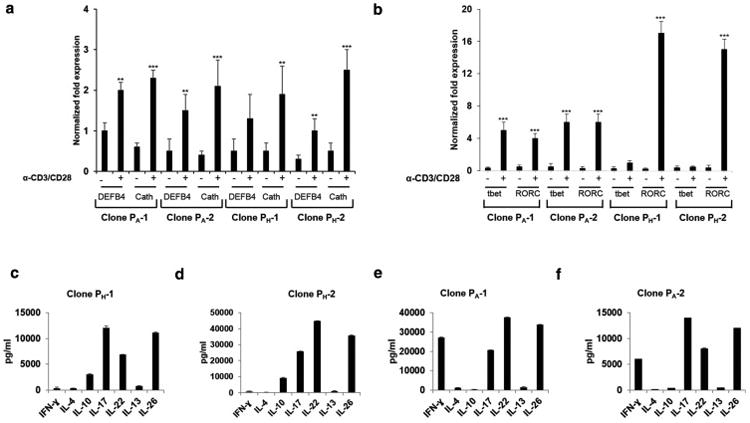
Fig. 4. Gene expression and cytokine profiles of PA and PH-strain specific clones.

(a-b) DEFB4, Cathelicidin (Cath), tbet, and RORC analyzed 24 h following (-) no or α-CD3/α-CD28 (0.75μg/ml) stimulation representative prTh17 clones (PH-1 and PH-2) and paTh17 (PA-1 and PA-2) generated from two different donors (D1 and D2) are shown. The results were also consistent for prTh17 and paTh17 clones generated from donors D3 and D4 (Supp. Fig 2). Gene expression was normalized to GAPDH. Data are representative of three independent experiments (n=3). Data represent mean ± SD (**p ≤ 0.05; ***p ≤ 0.001). (c-f) PA and PH-strain specific clones were stimulated as above, and cytokine levels accumulated in the culture supernatants were measured using ELISA.
