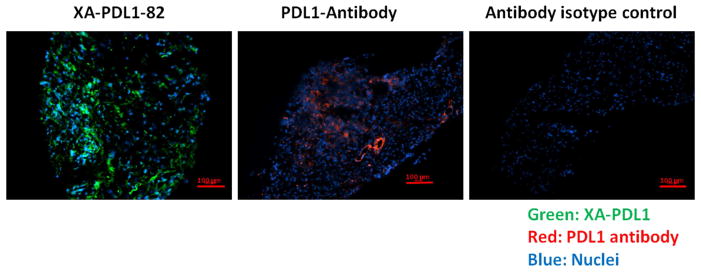
Figure 4.
Detection of PD-L1 expression on human pancreatic tumor tissue. Sections of human pancreatic ductal adenocarcinoma tissue were incubated with XA-PDL1-82 (25 nM) or PD-L1 antibody (4.8 μg/ml), followed by streptavidin FITC (green) or Goat Anti-Rabbit IgG (Alexa Fluor® 647) secondary antibody at 1/1000 dilution (red). Hoechst 33342 was used to stain the cell nuclei (blue). An IgG isotype was used as negative control. Expression level of PD-L1 was determined by fluorescence intensity of FITC or AF647.

